ArcGIS API for Javascript:
Ski Resorts
During these turbulent times, I have realized just how lucky I am for my health, my family, and to be employed. I have spent a lot of my free time during quarantine day-dreaming about skiing. Every ski resort in California is currently closed, rightfully so, in order to reduce the spread of COVID-19. This past March, the Sierra mountains saw a huge uptick in snowfall, after a remarkably poor showing in February:
Top Of Squaw Valley, CA (8000 Feet):
Monthly Snow Totals, 2020 Season
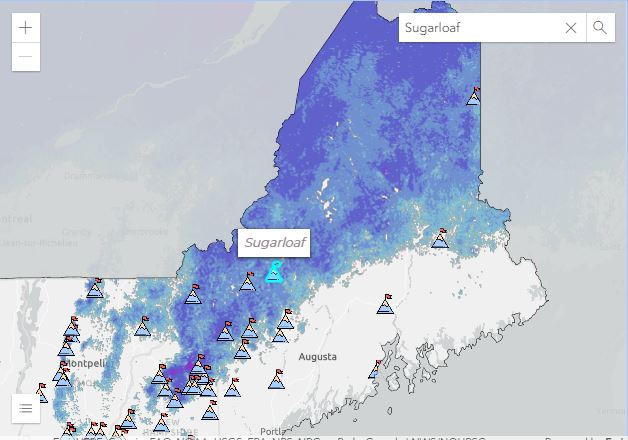
2 inches in February, to 151 inches in March. Magical March hit. While surfing around I discovered an awesome rest service issued by NOAA: NOHRSC Snow Analysis. This MapServer shows snow depth for most of North America. It's created by interpolating snow depth report data from various weather stations.
I decided to use the ArcGIS API for Javascript to visualize it. I also put on a point layer showing ski resort locations for the contiguous US:
How I Made This Map:
The first step involved loading the necessary modules for the map application I had in mind, using an AMD require statement. The MapImageLayer module will be used for NOAA's MapServer. I knew I wanted to have an expandable legend for the snow depth layer, so I included the Legend and Expand modules. The GeoJSONlayer module will allow me to add my Github Gist, which contains a point geoJSON file of ski resorts, onto the map. The Search module will allow users to search by ski resort name, using the "Name" field within the geoJSON layer:
I set the basemap option to "gray-vector" to give my map a simplified look. You can find a list of default basemap settings here. Since this is a 2D map, I used the MapView Module (3D maps use the SceneView module). I set the container to "SkiMap", which will be used later to restrict the map size in the CSS and to load the map in the HTML. I set the center of the map to the Lake Tahoe region and set the initial zoom to 8. Since this is a large MapServer, I restricted users ability to zoom out, in the hopes of improving mapping speeds:
I loaded in NOAA's MapServer layer. After investigating the rest service further, I found that it was made up of 7 different layers. I was only interested in the snow depth layer (id = 3), so I used the sublayers option to set its visibility to true:
Below I set up the legend within an expand function. This gives me the ability of having the legend collapsed when the application is opened, and gives users the flexibility of opening and closing it when needed.
I had to mess with the application's CSS classes quite a bit to adjust how the legend is displayed. I used the inspect tool within the developer tab of Google chrome to find the classes that I needed to edit:
In the next step, I set up a renderer variable that would act as a styling template for the ski resort geoJSON. I also added a very simple pop up template using the GeoJSON’s NAME field. I applied both options within the GeoJSON function:
Once again, I needed to dig around the applications default CSS classes to improve the display of the pop-ups. The default pop-up is way too clunky, all I want/need the pop-ups to display is the ski resort's name:
In order to create the gray "background" outside the borders of the map that you see above, I made a large polygon shapefile and used the "Erase" tool in ArcGIS Pro to remove the shape of the continental United States. I then styled it to have the same color code as the gray-vector basemap:
The last step was to allow users to search by ski resort name using the geoJSON's "Name" field:
...and some final CSS styling on the search widget to remove the suggestion drop down: