Cartography and Data Visualization Class Portfolio
Final cartography projects from my Master's in GIS
completed on: 2021-08-13
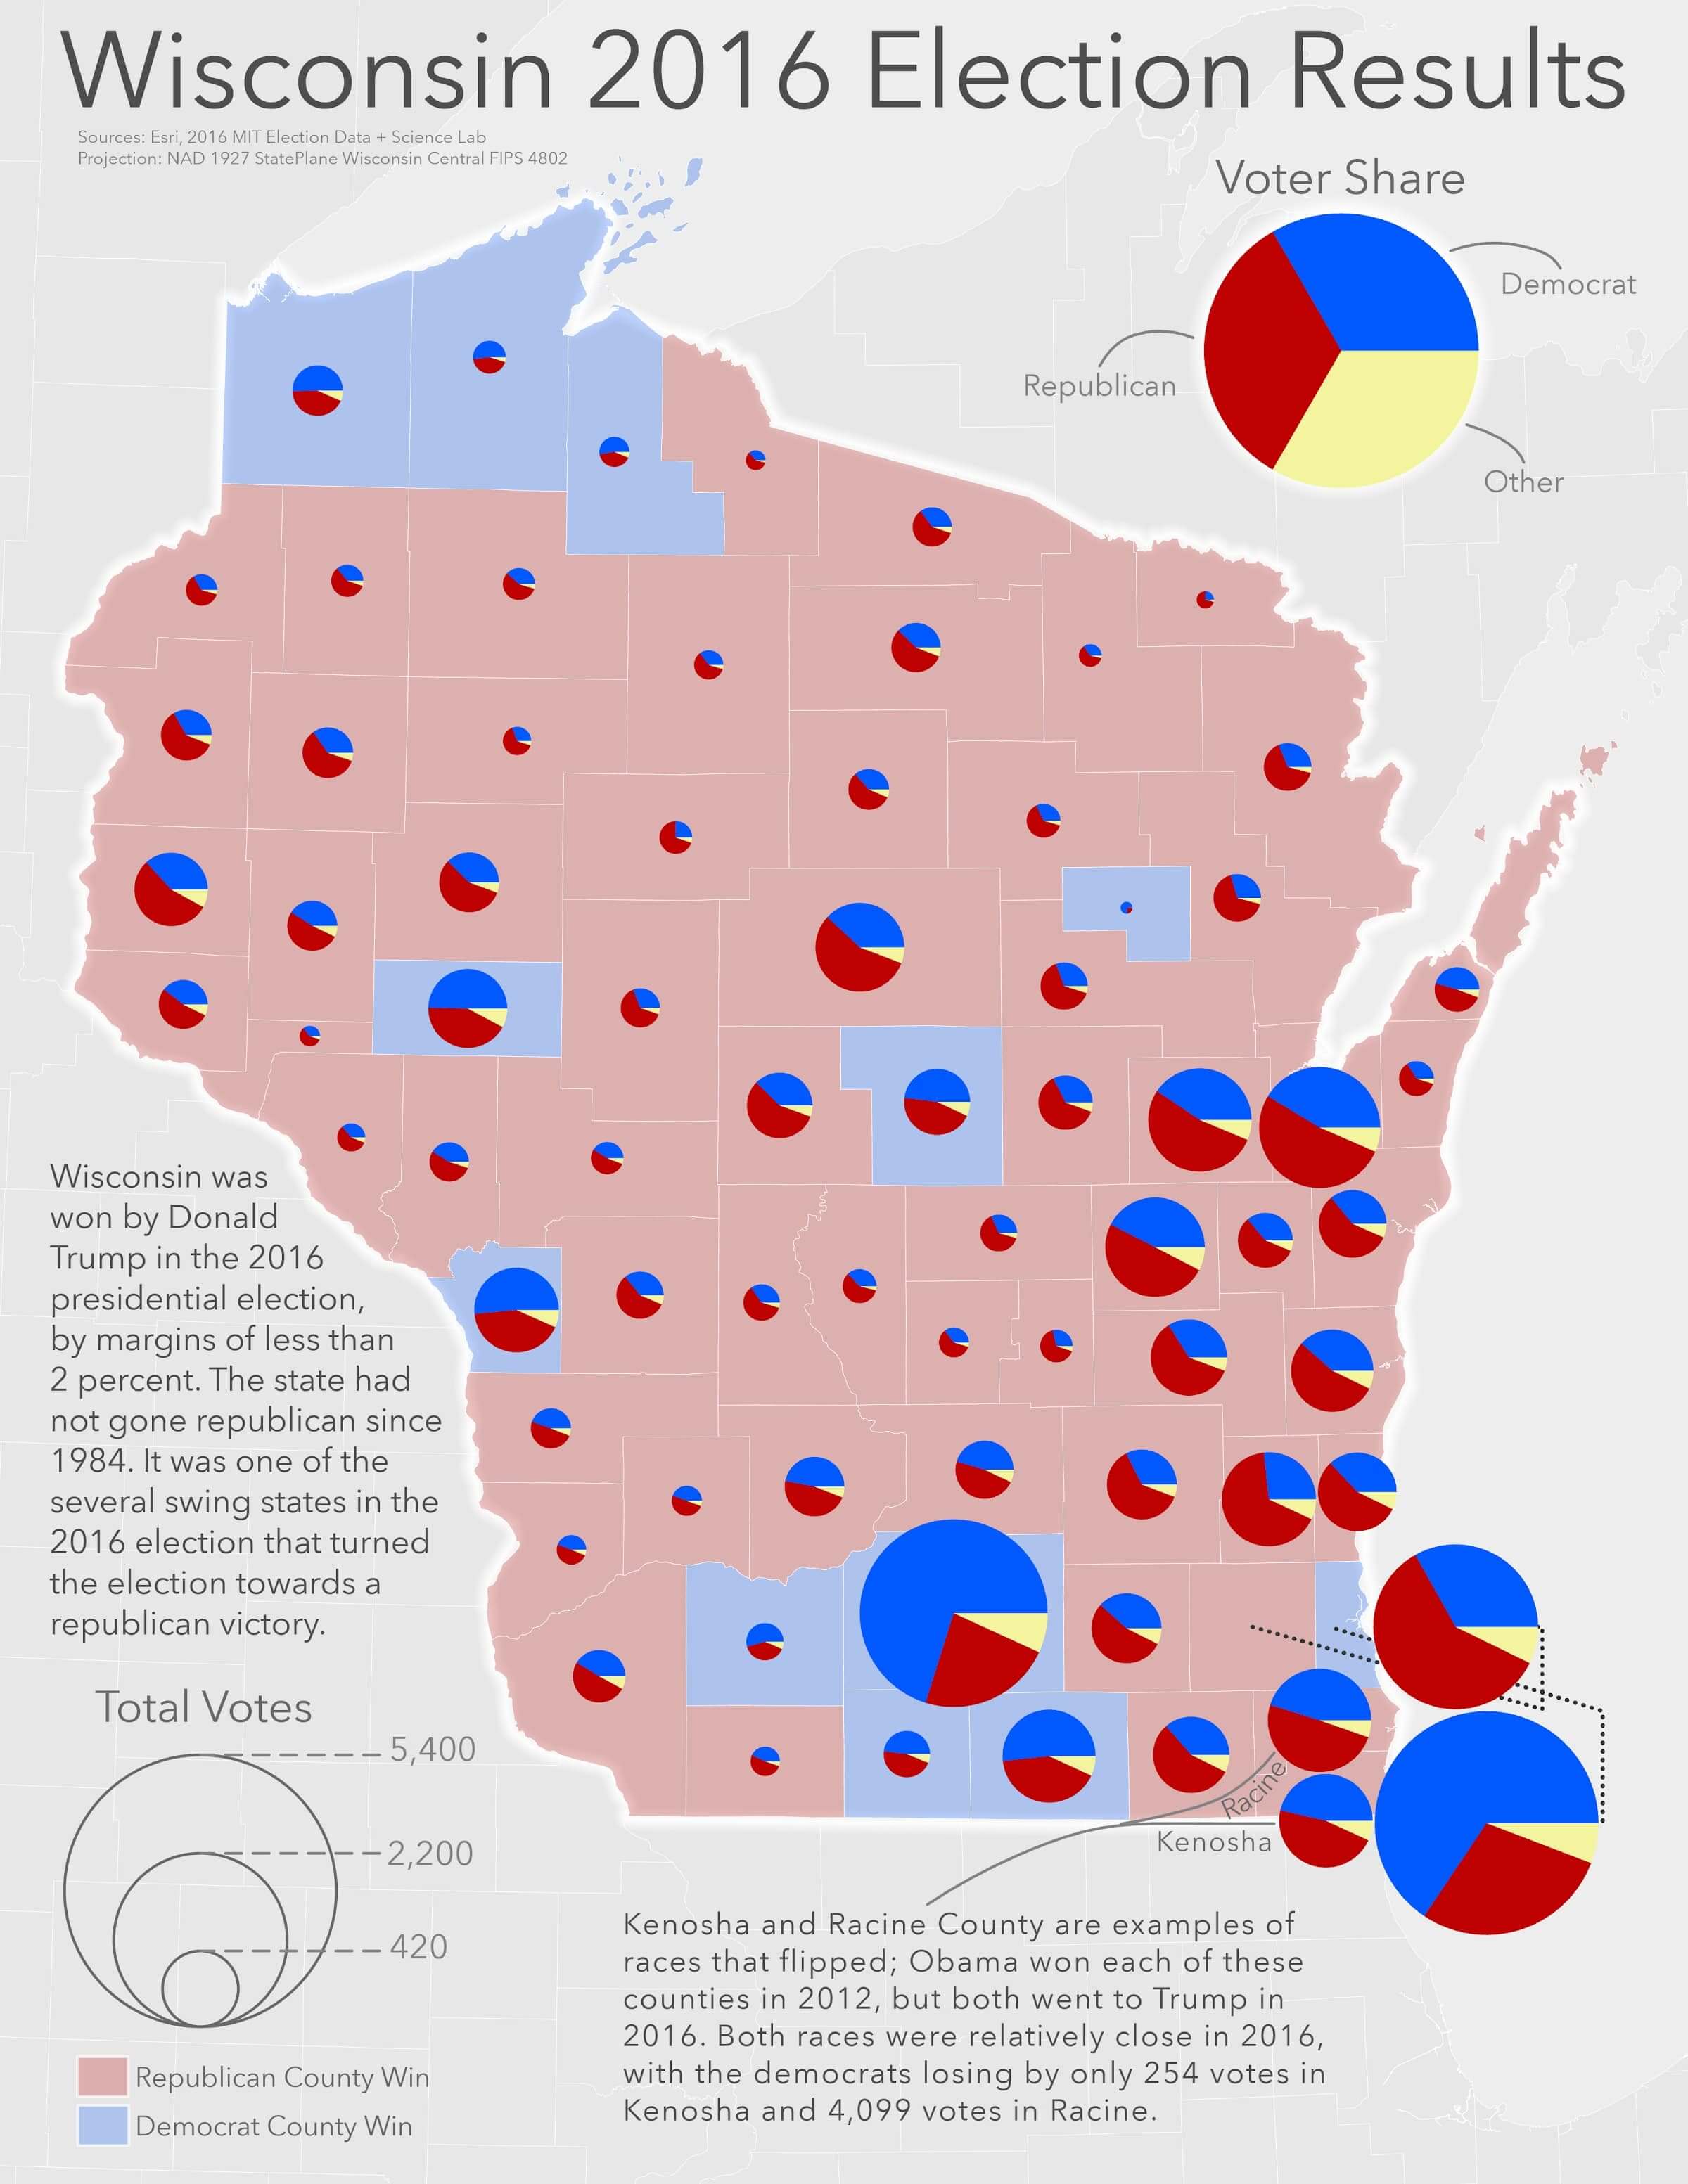
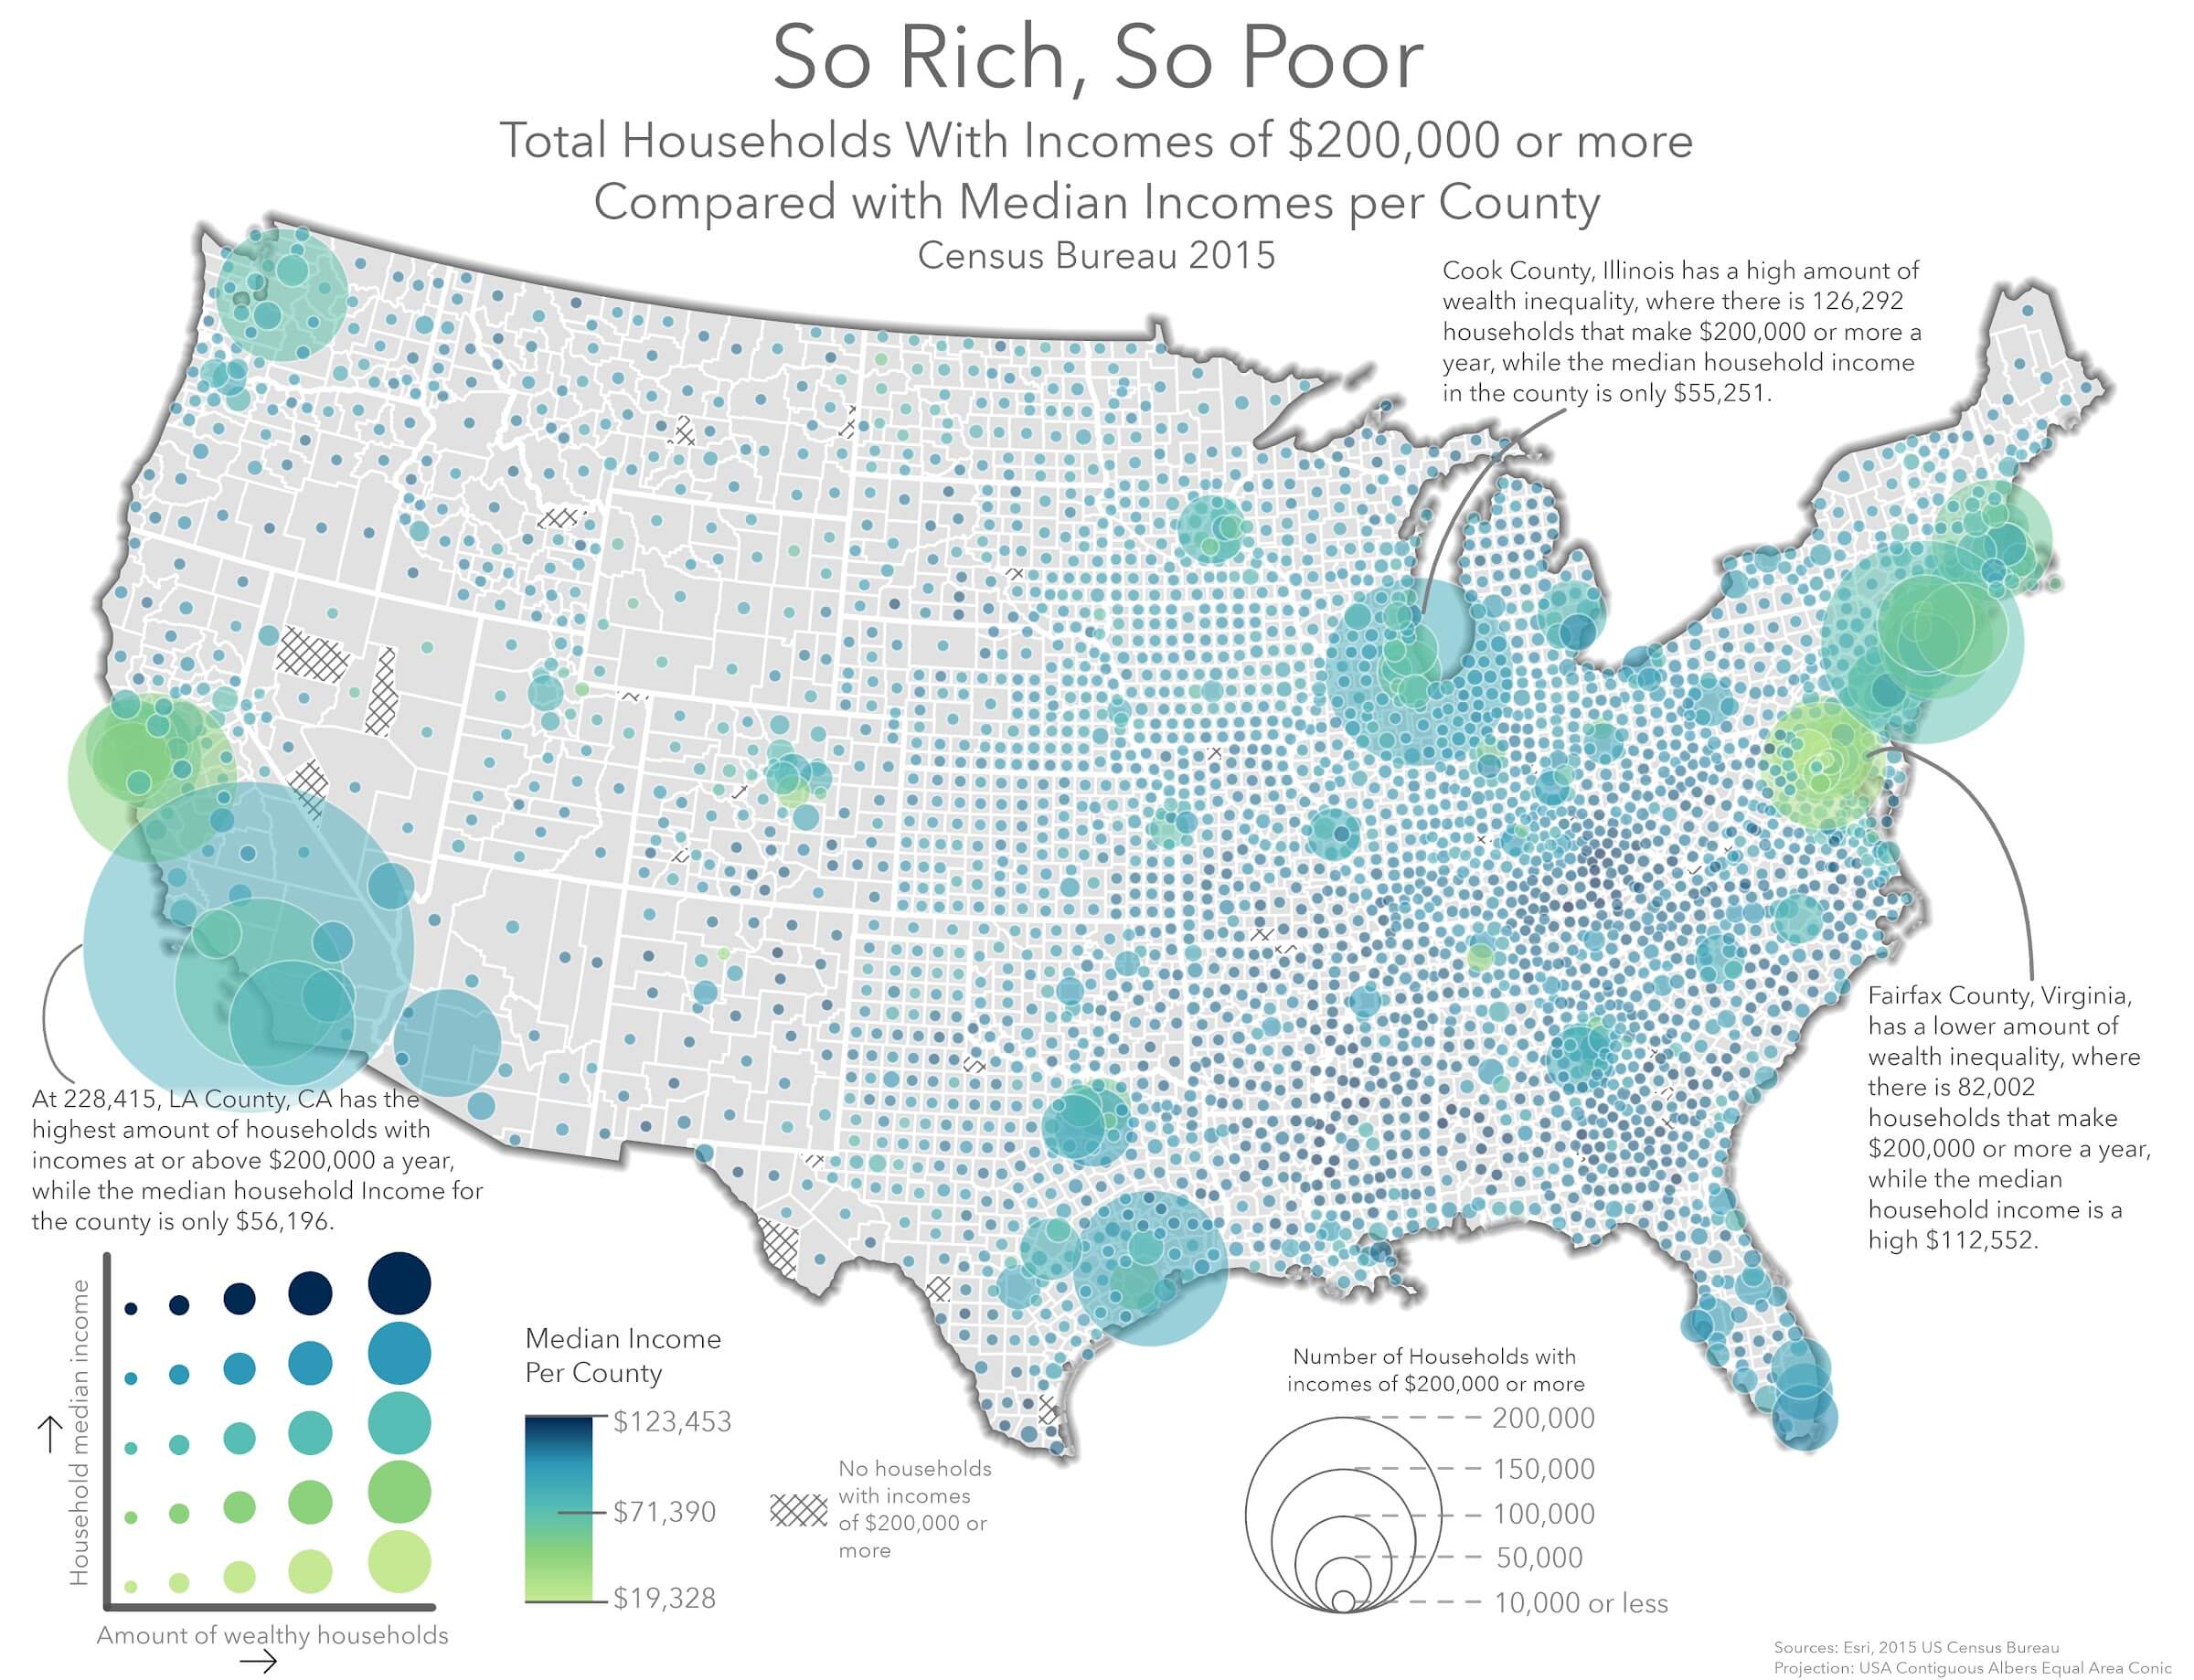
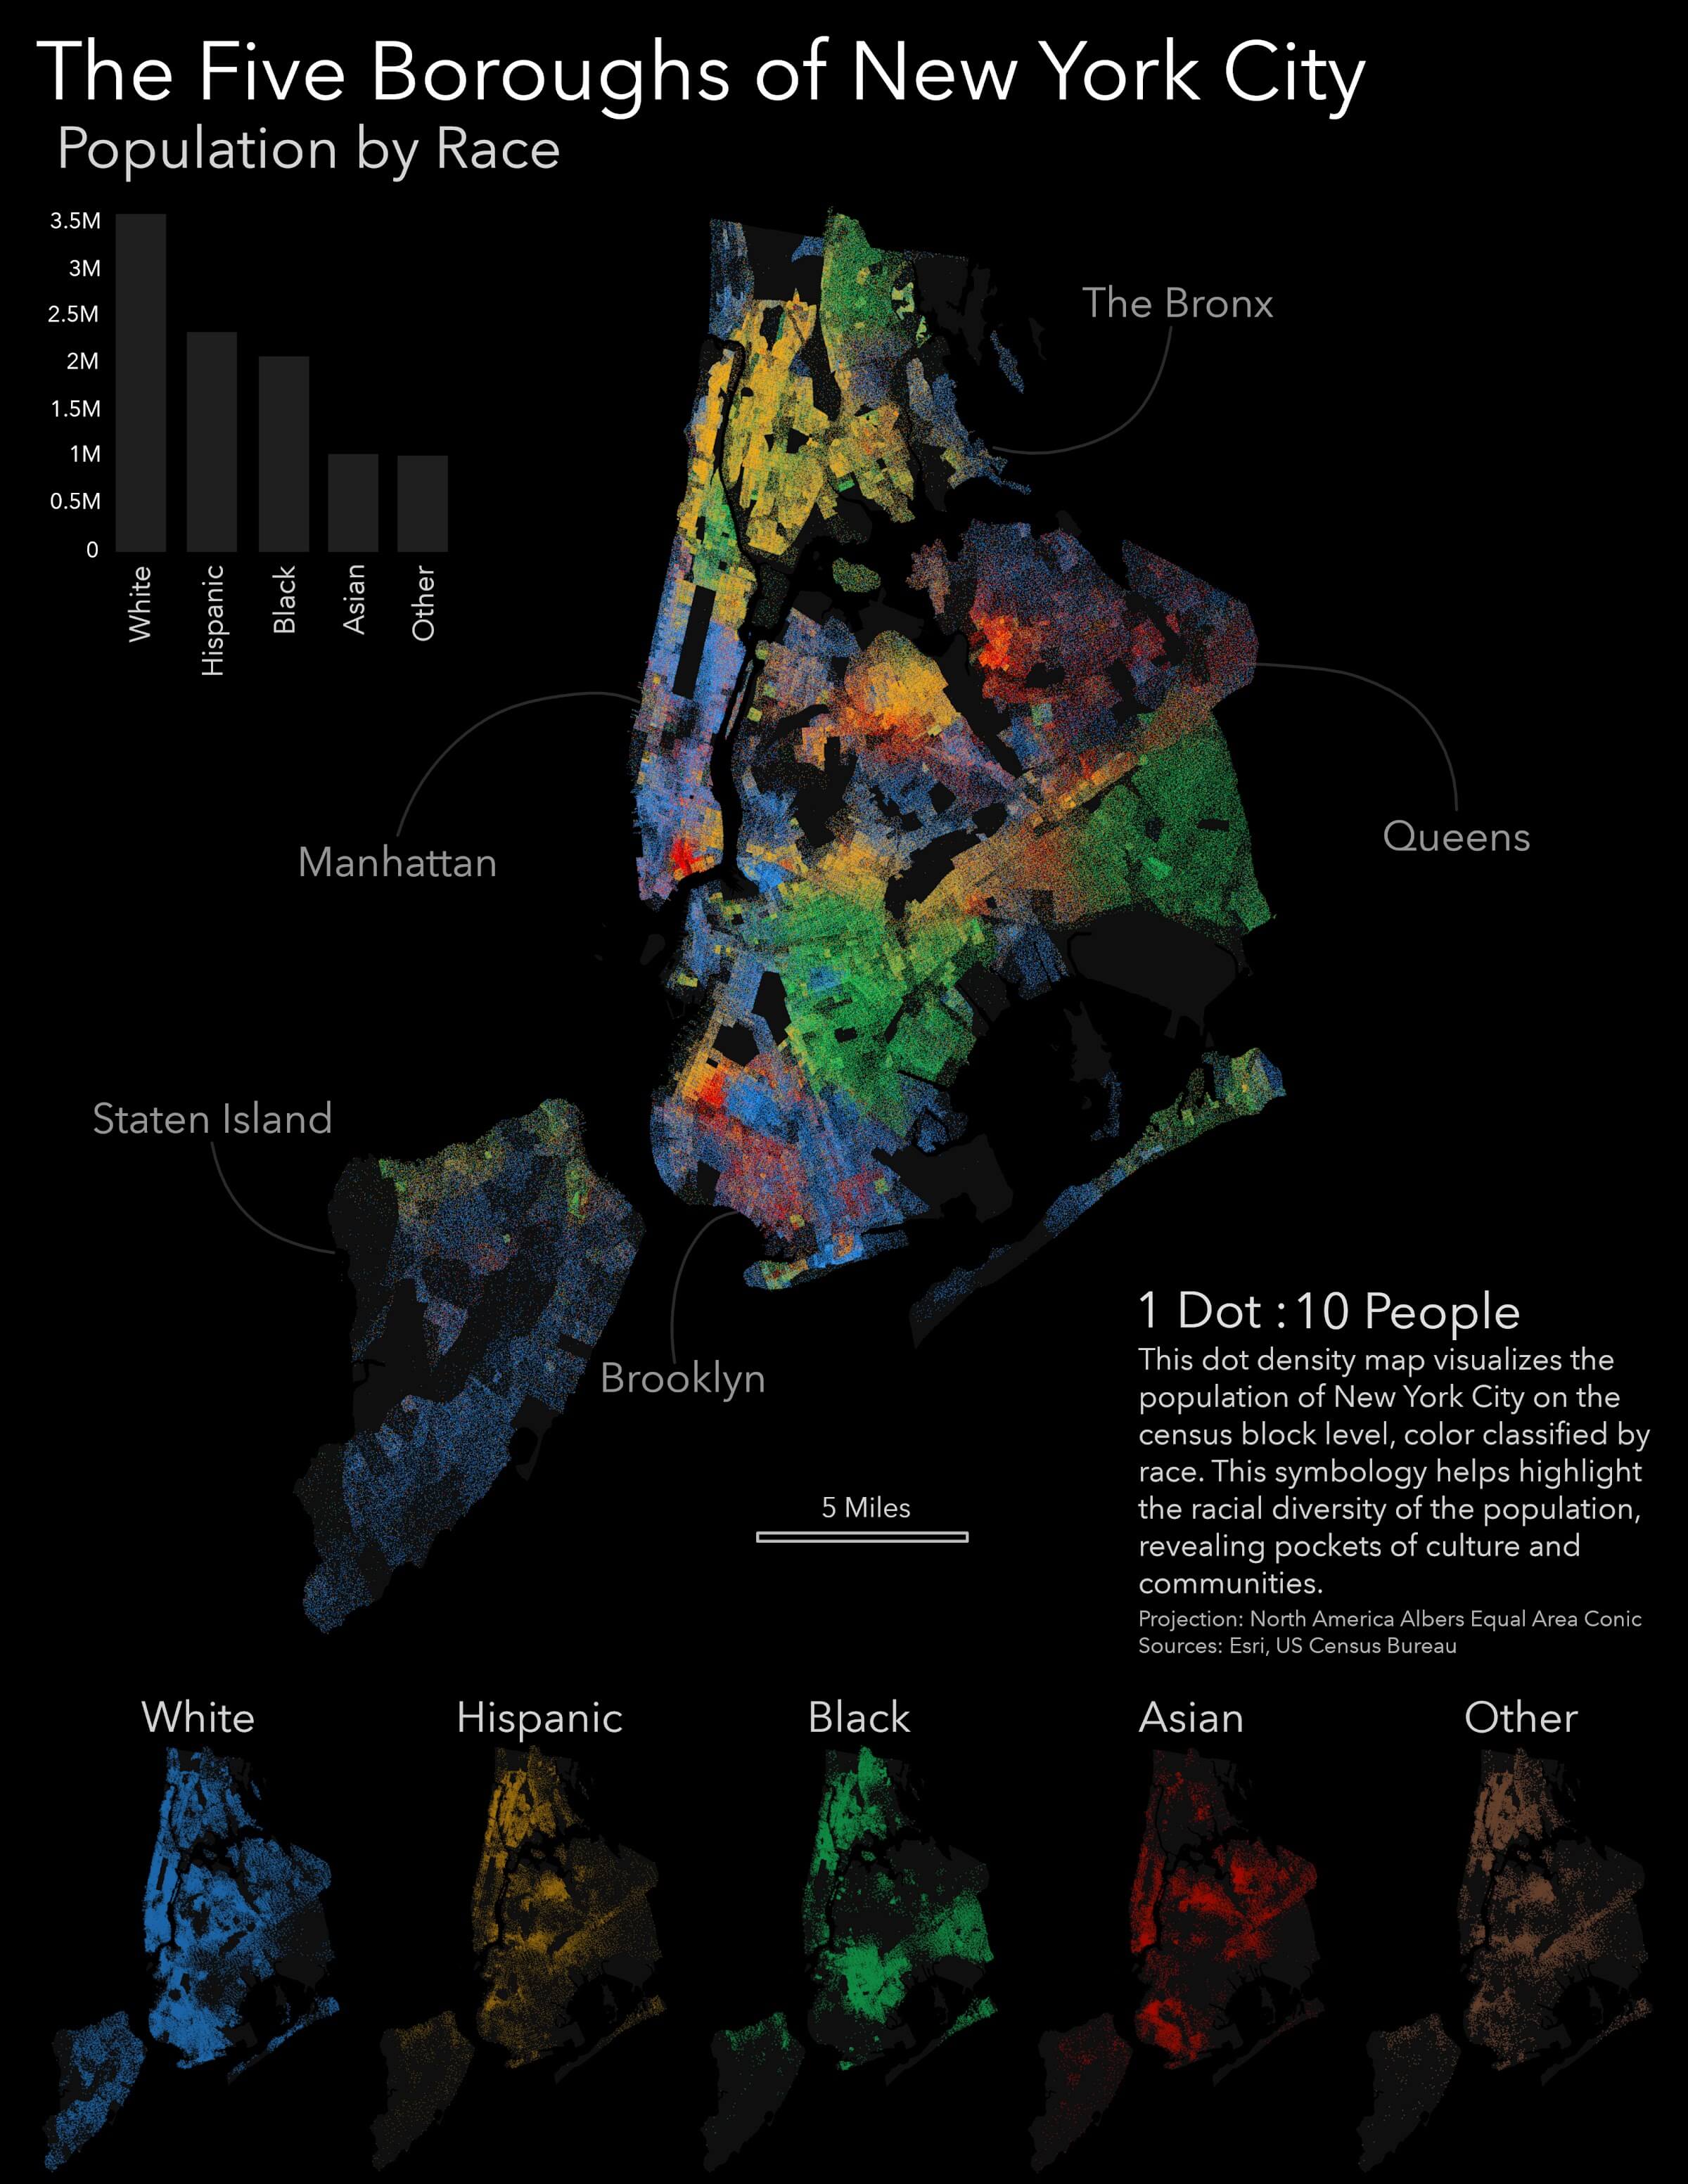
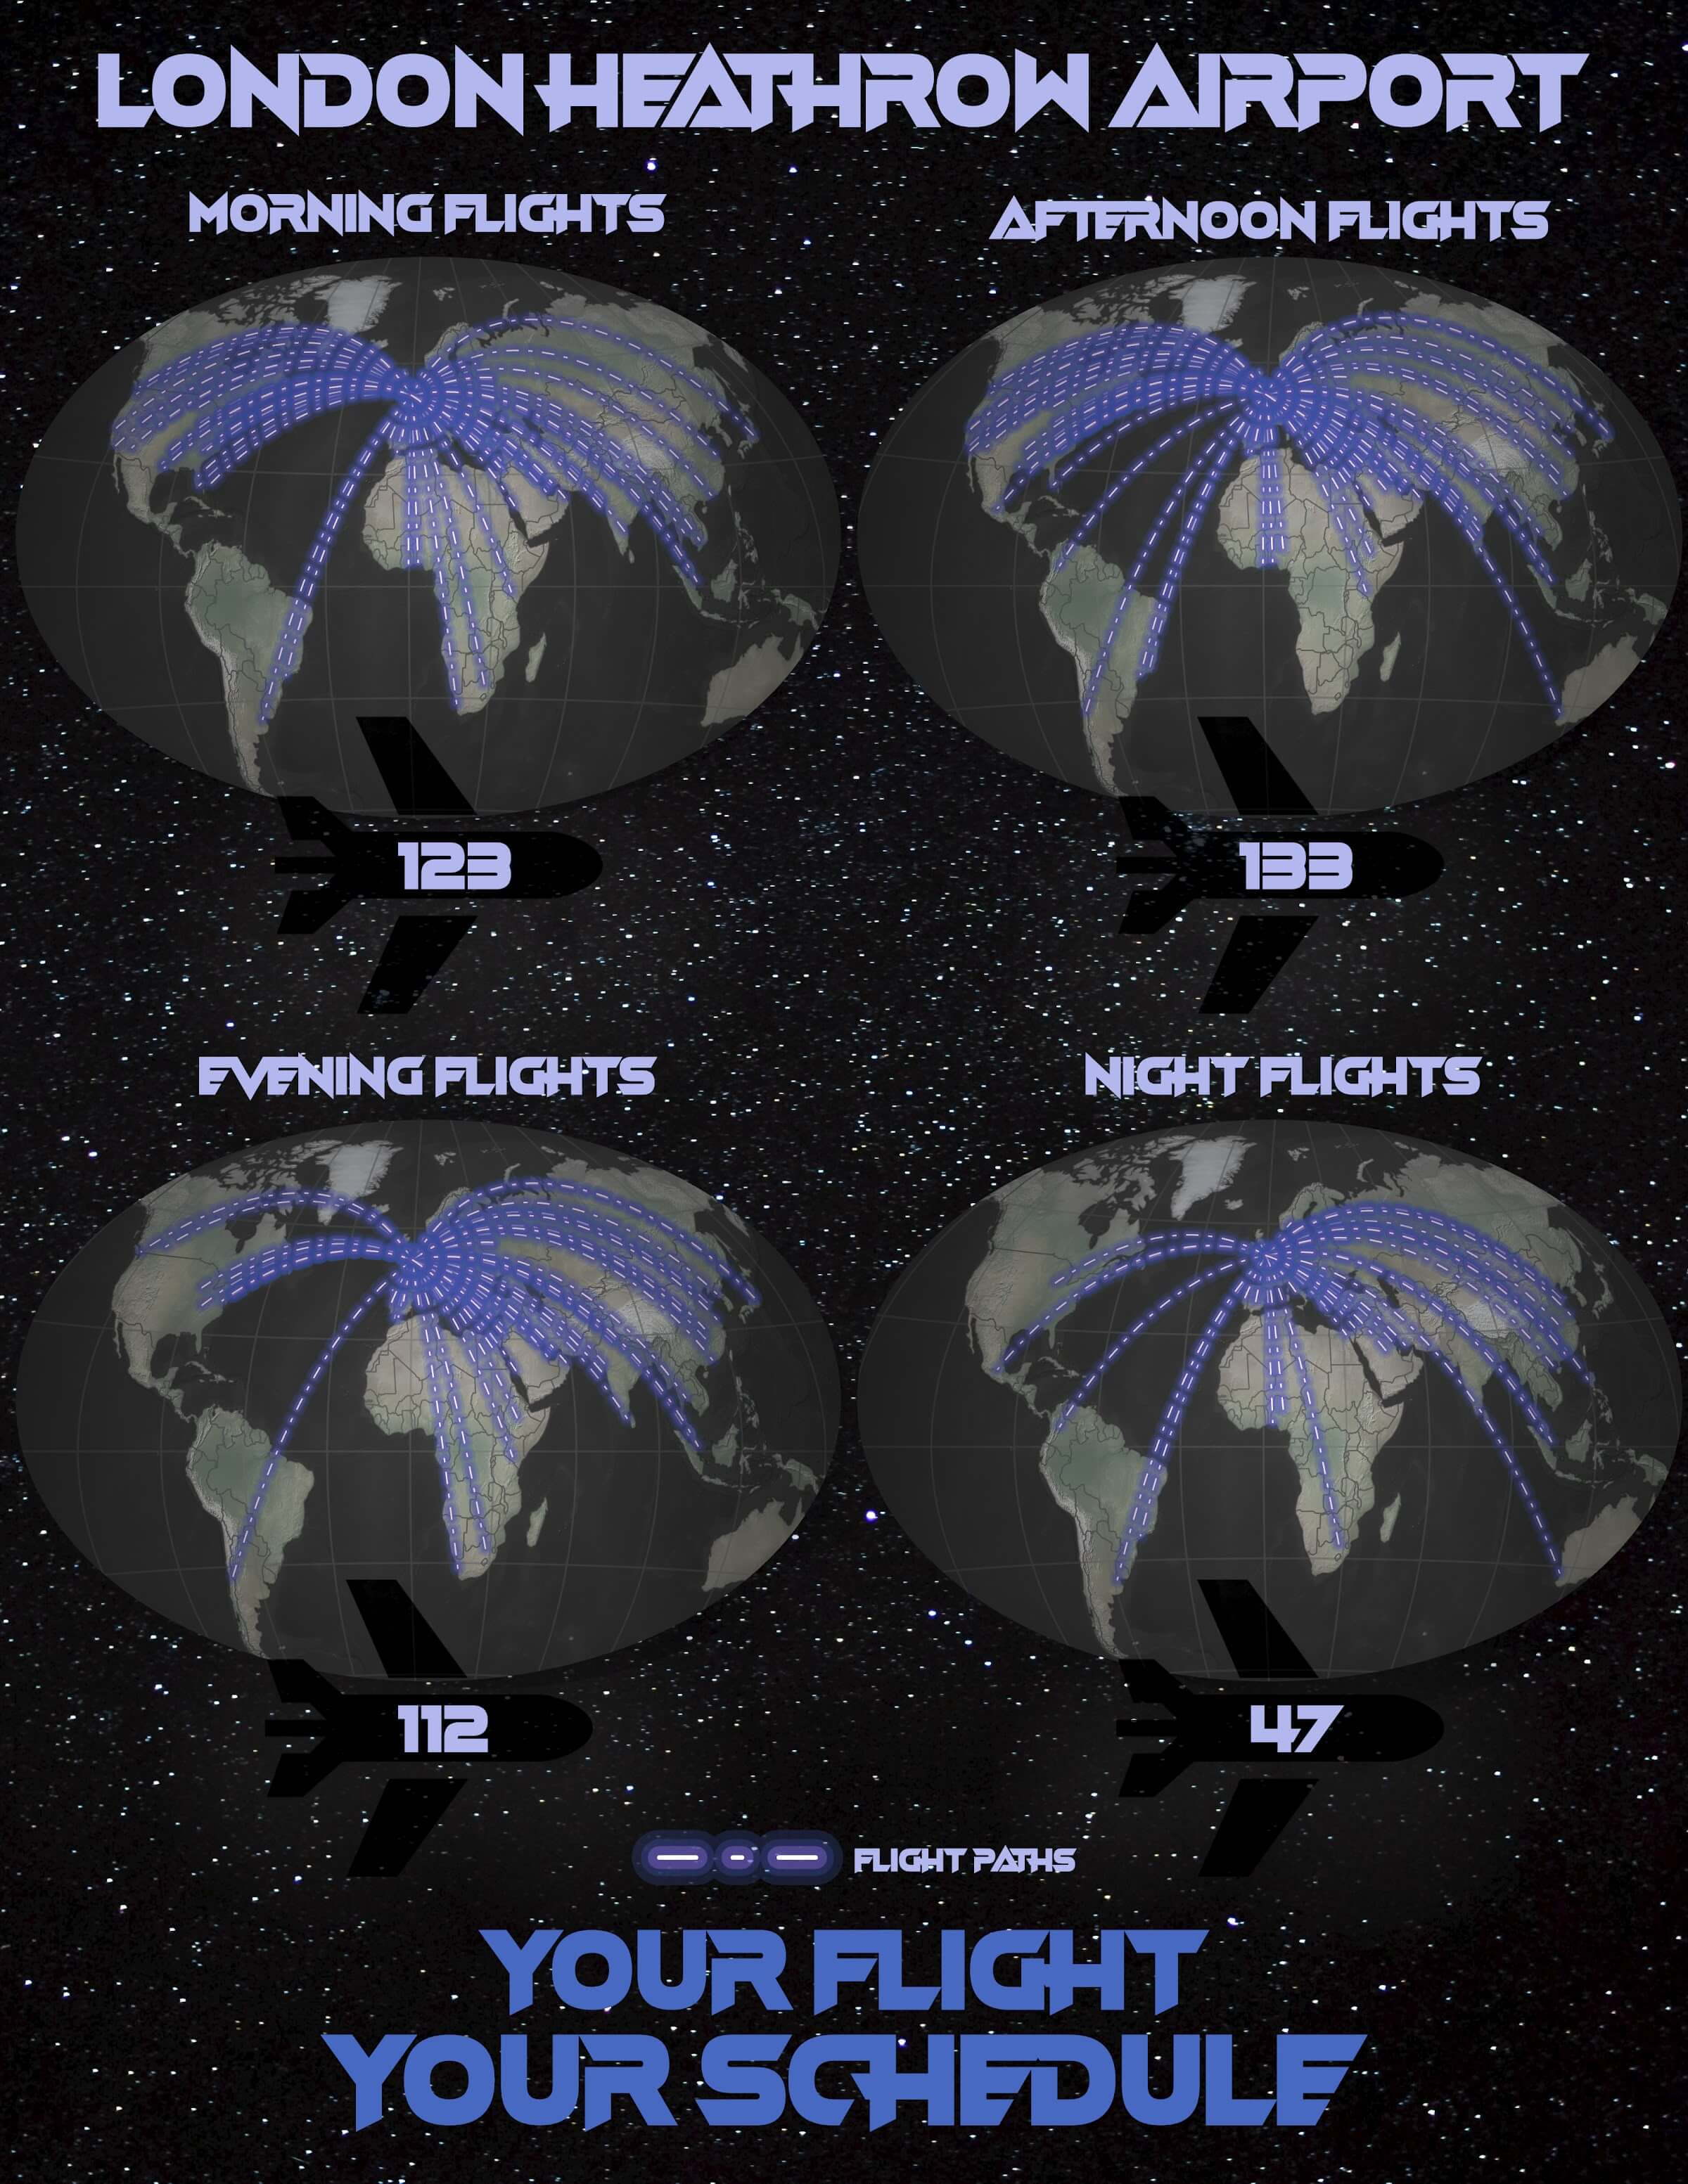
I finished up my Cartography and Data Visualization class for my masters program last weekend. Overall, it’s been a great experience practicing my cartography while receiving constructive feedback from my classmates and professors. The course challenged me to think creatively while using data and design styles that I have not previously attempted to use. Below you can find some of the favorite graphics I created during the course:
Dot Density
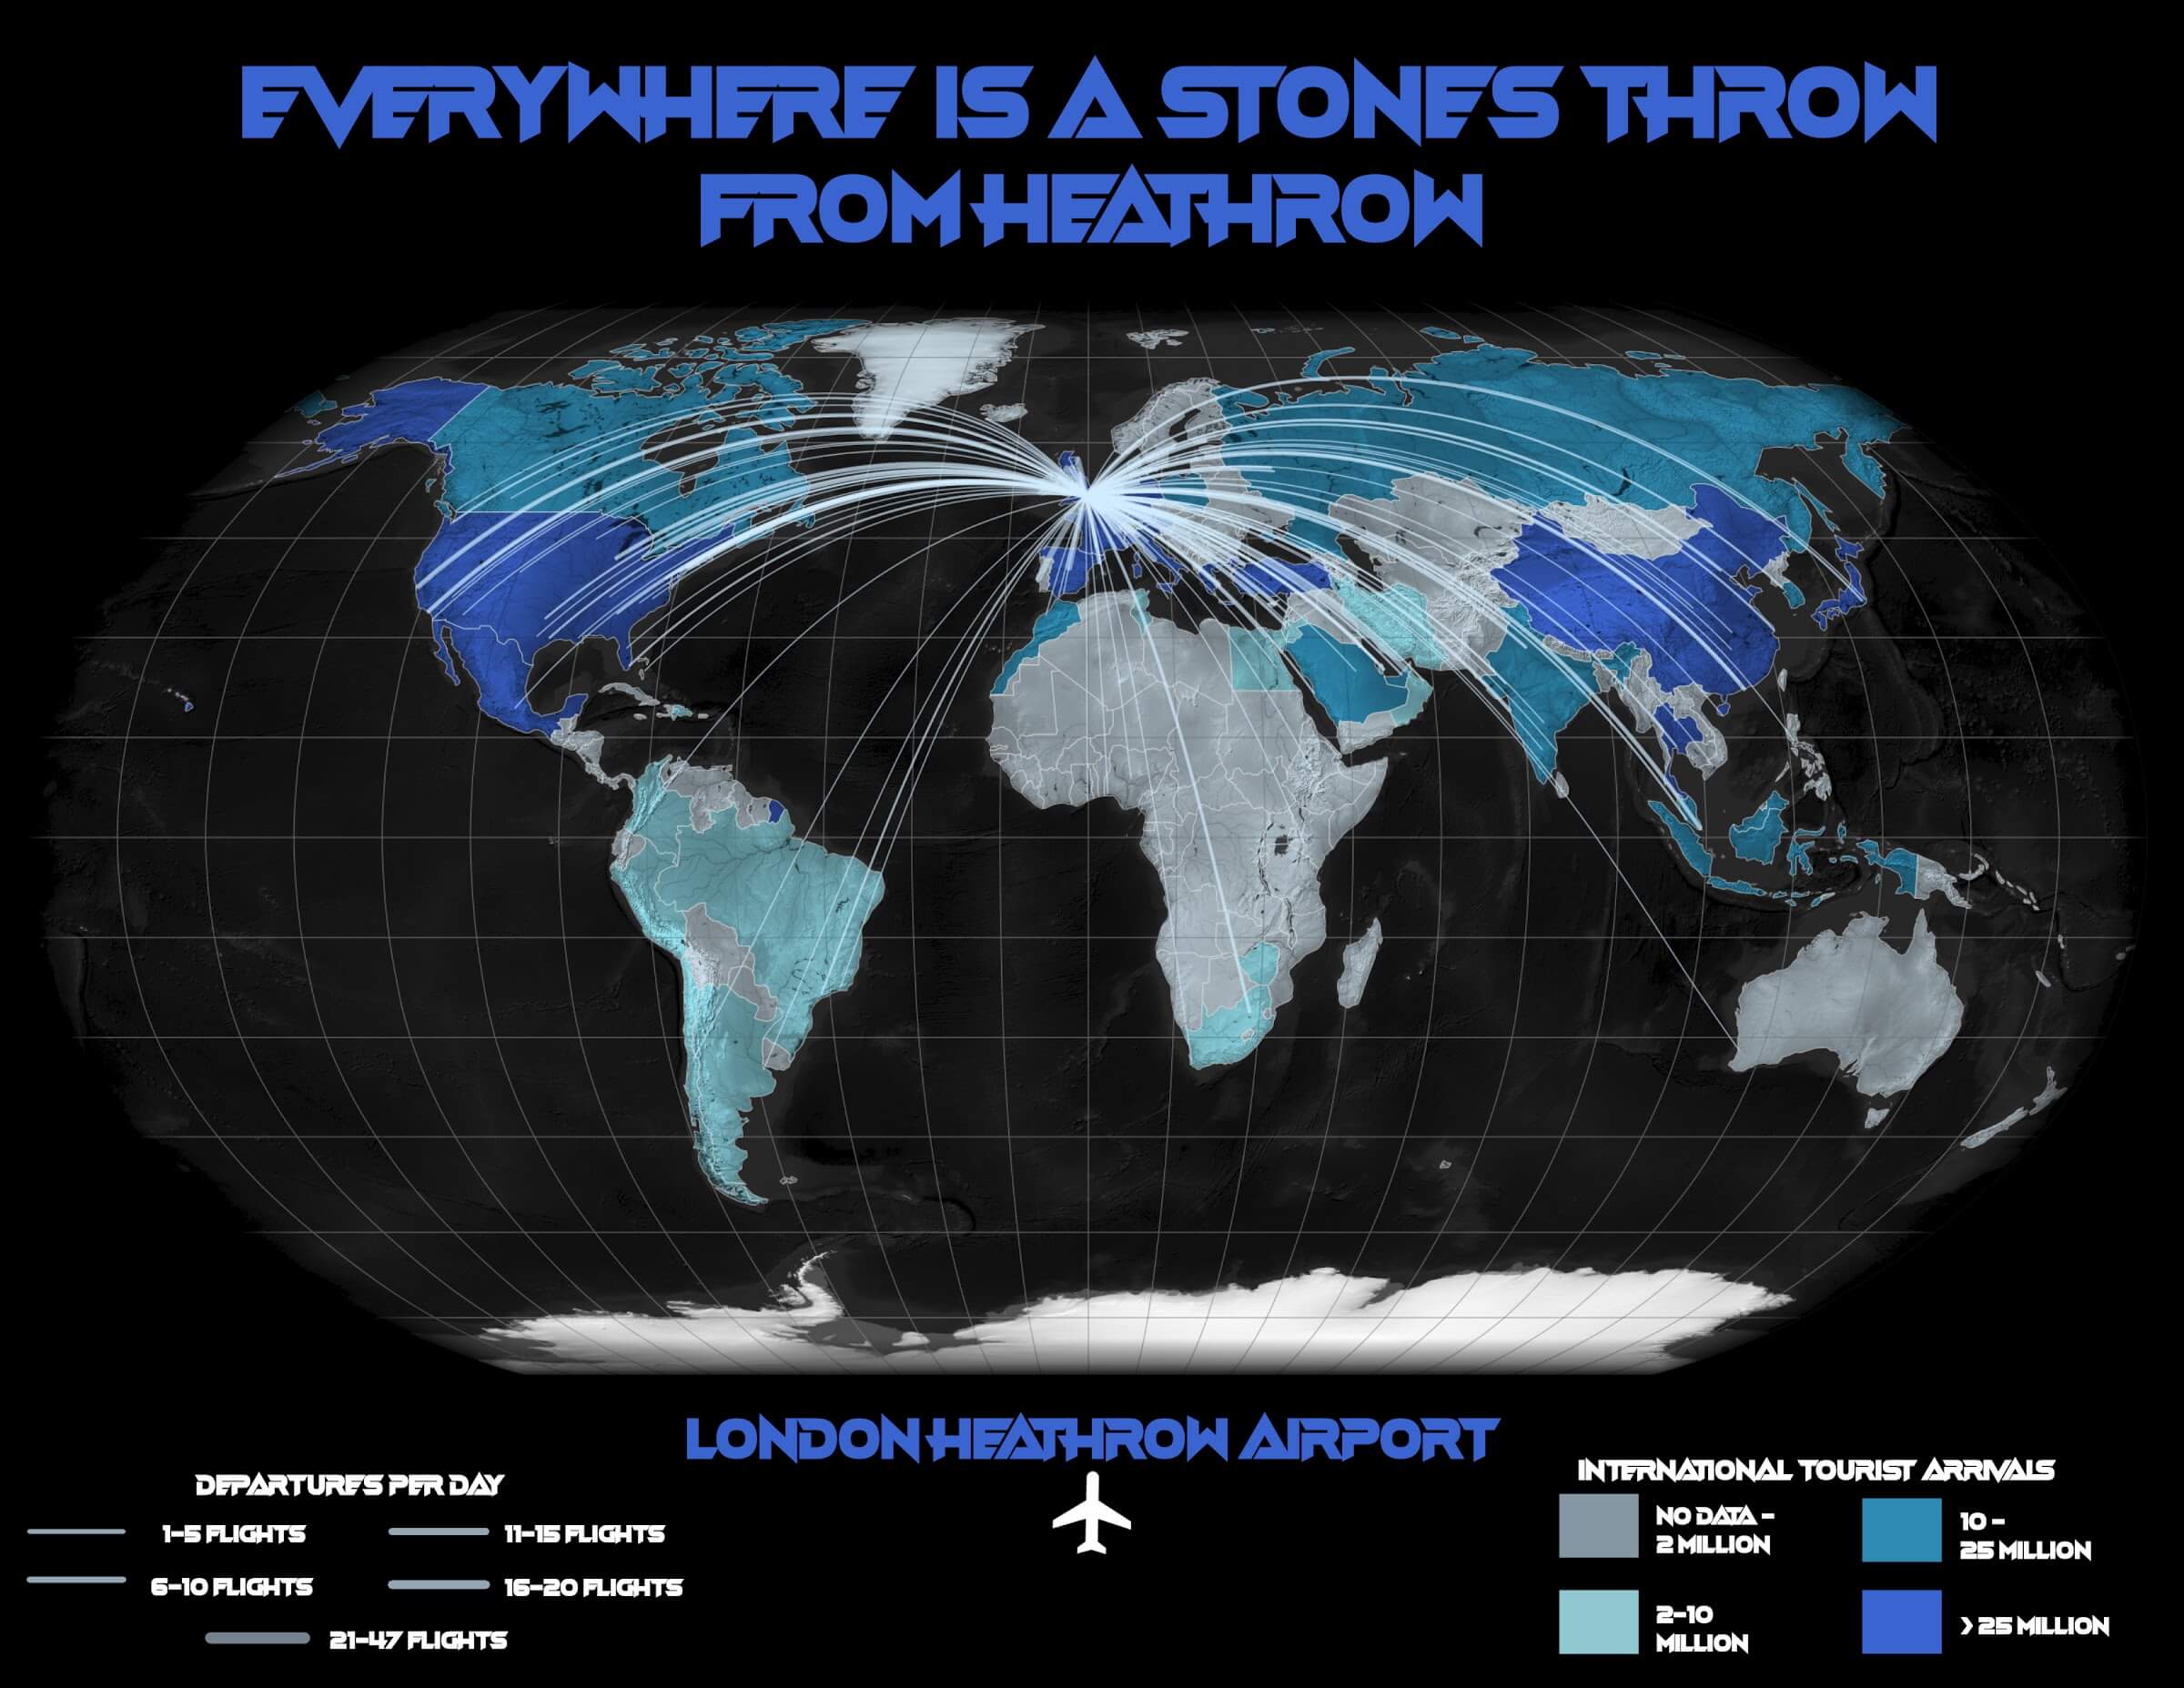
Advertising Maps: London Heathrow Airport
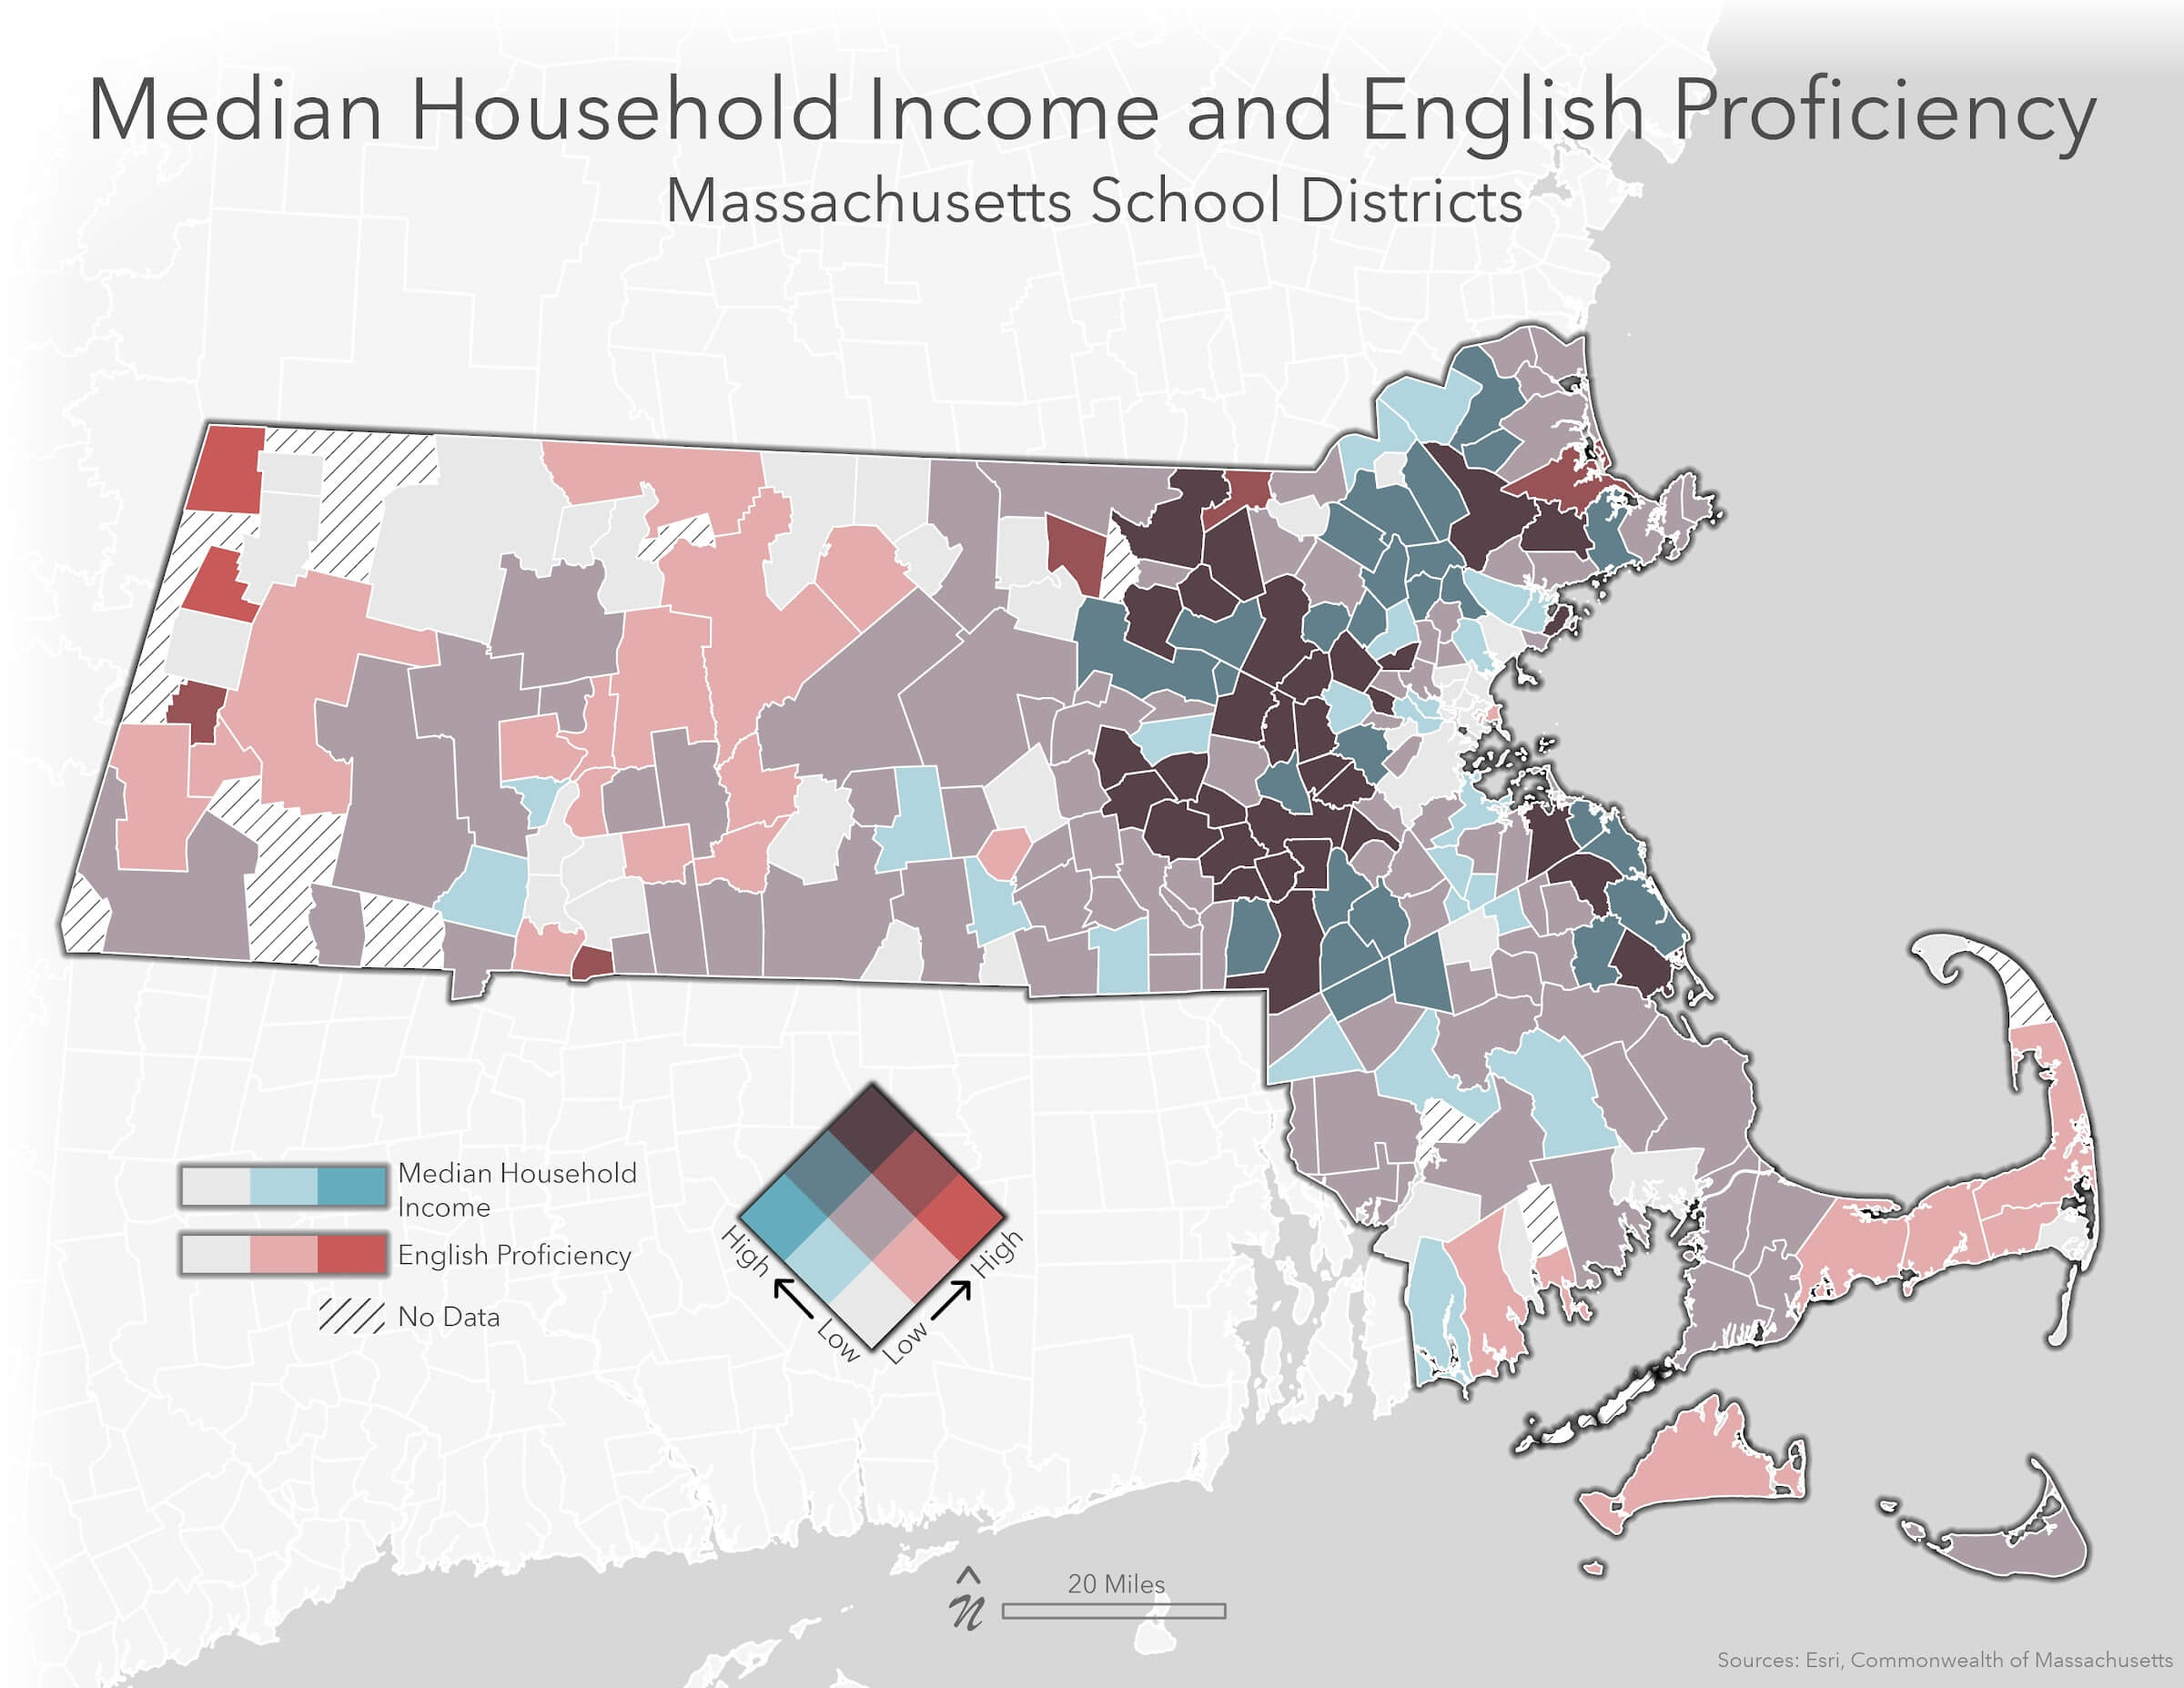
Bivariate Choropleth Maps
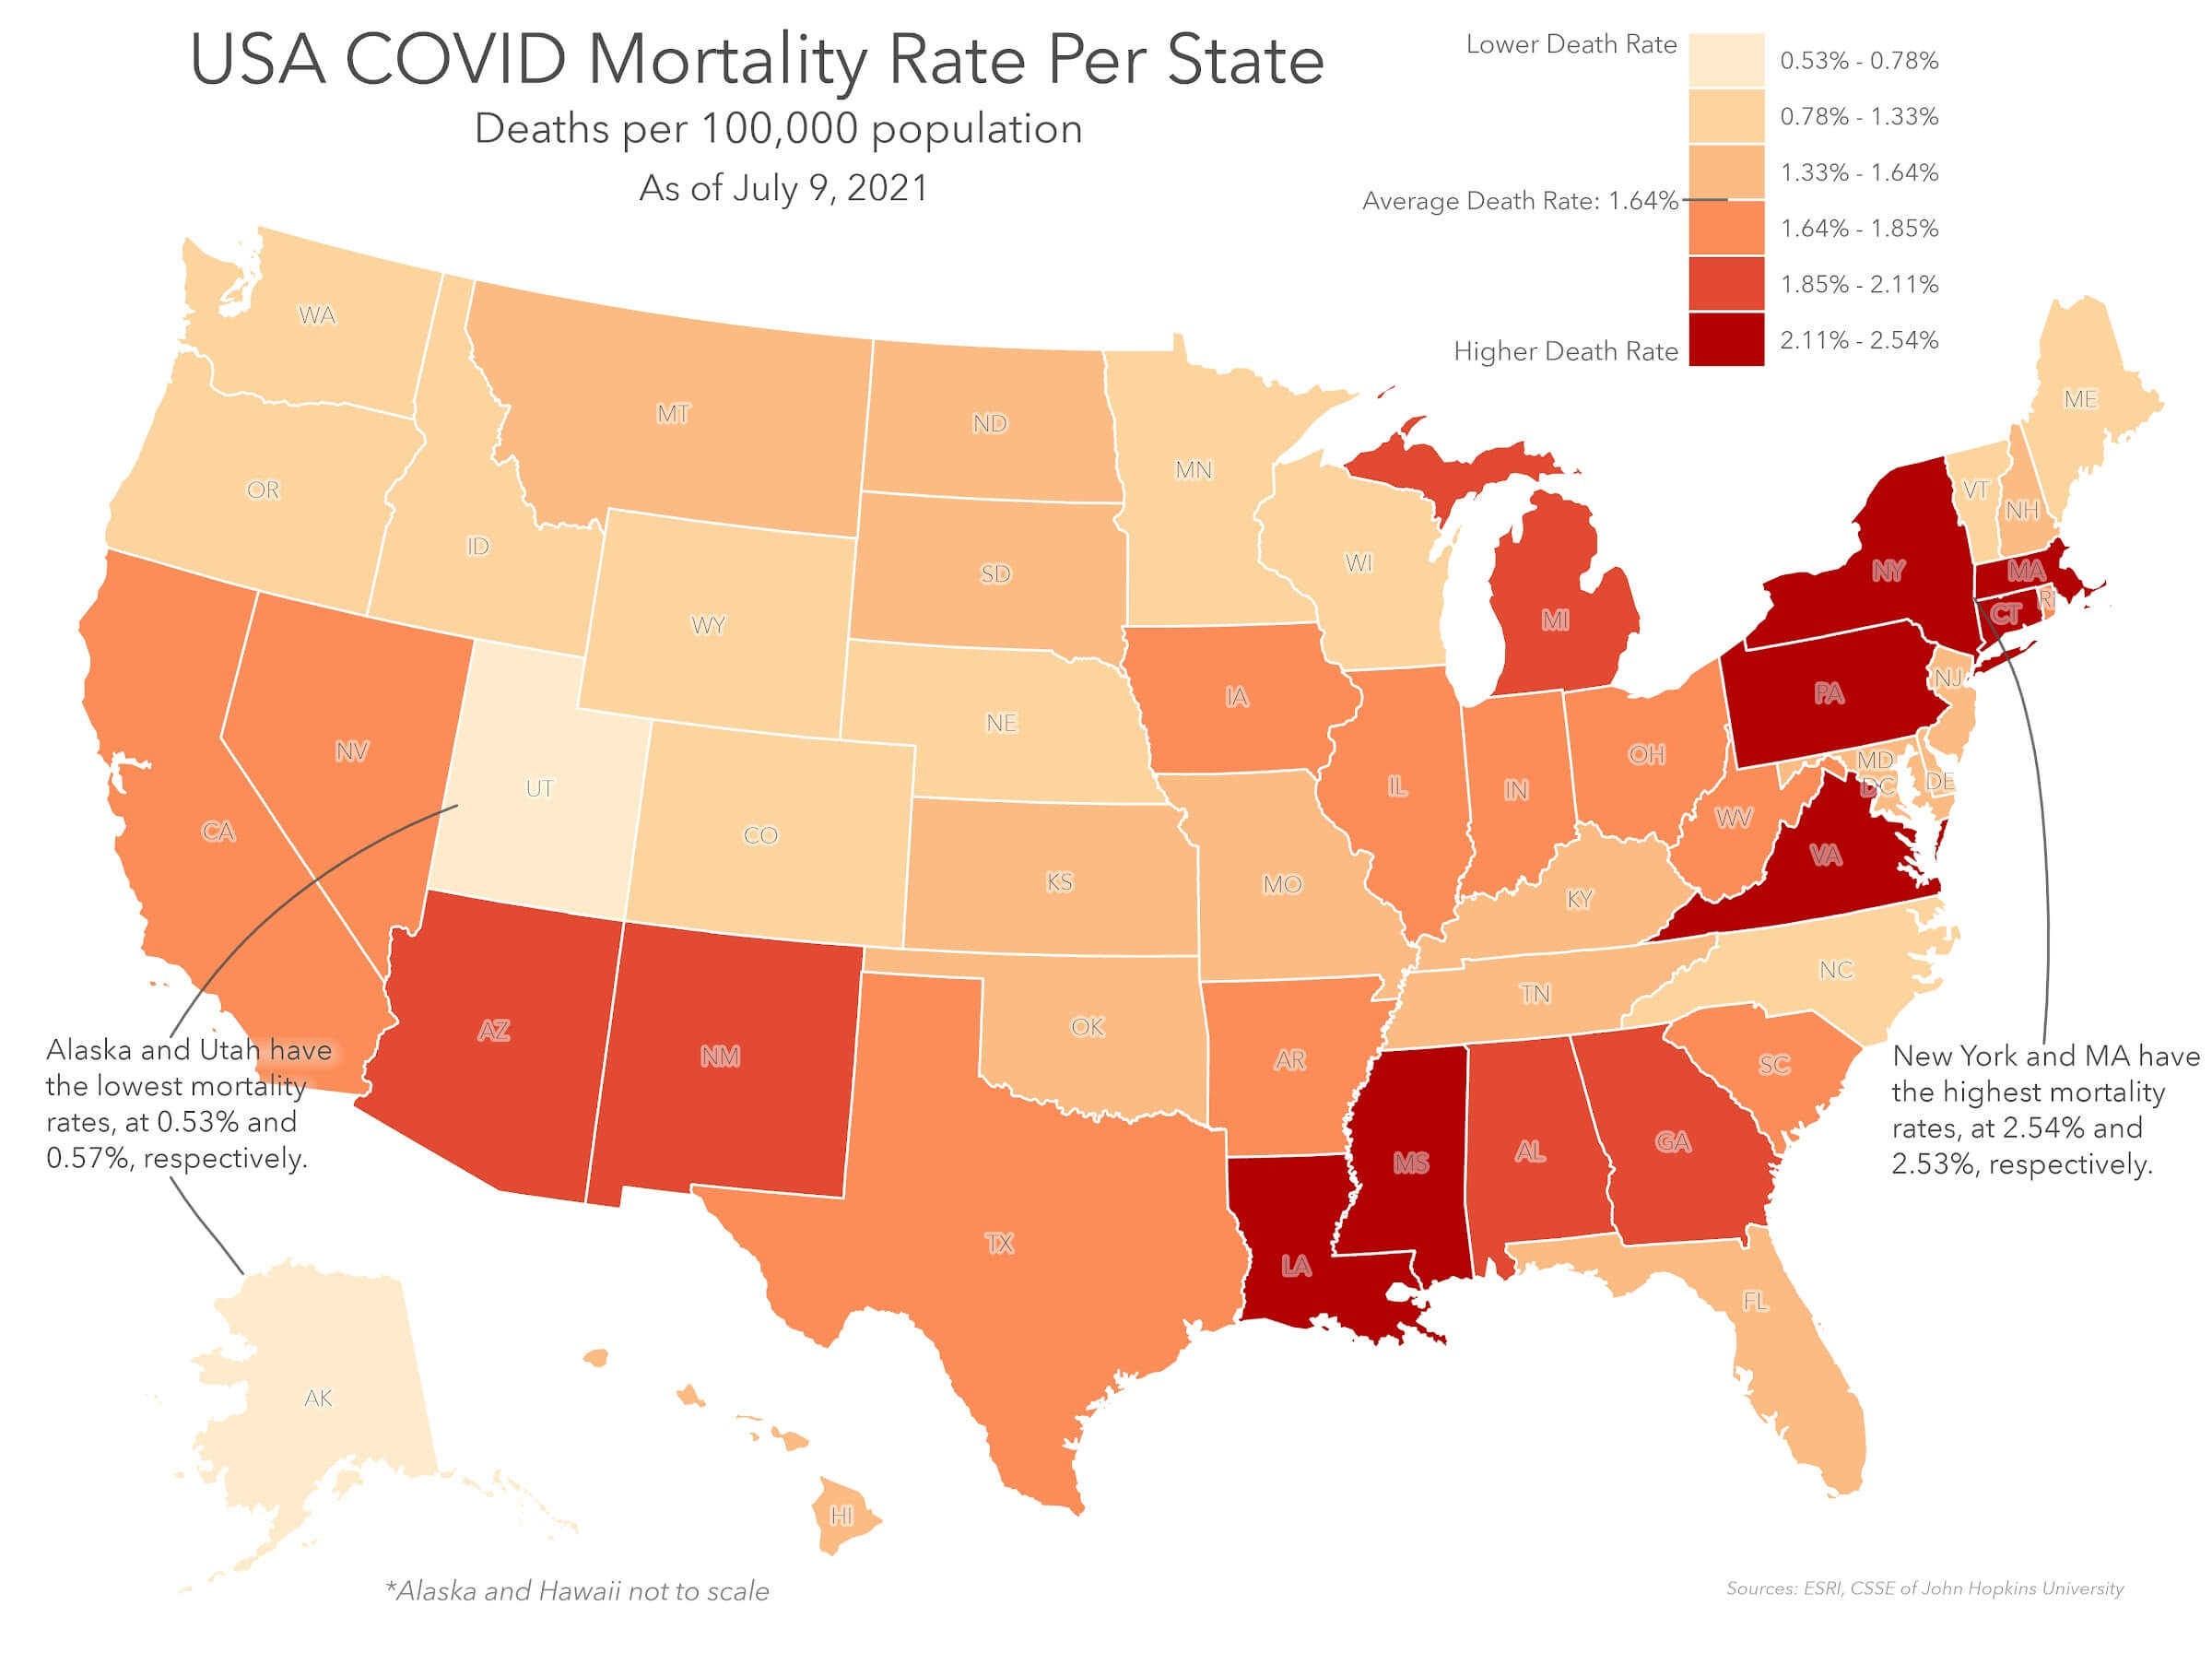
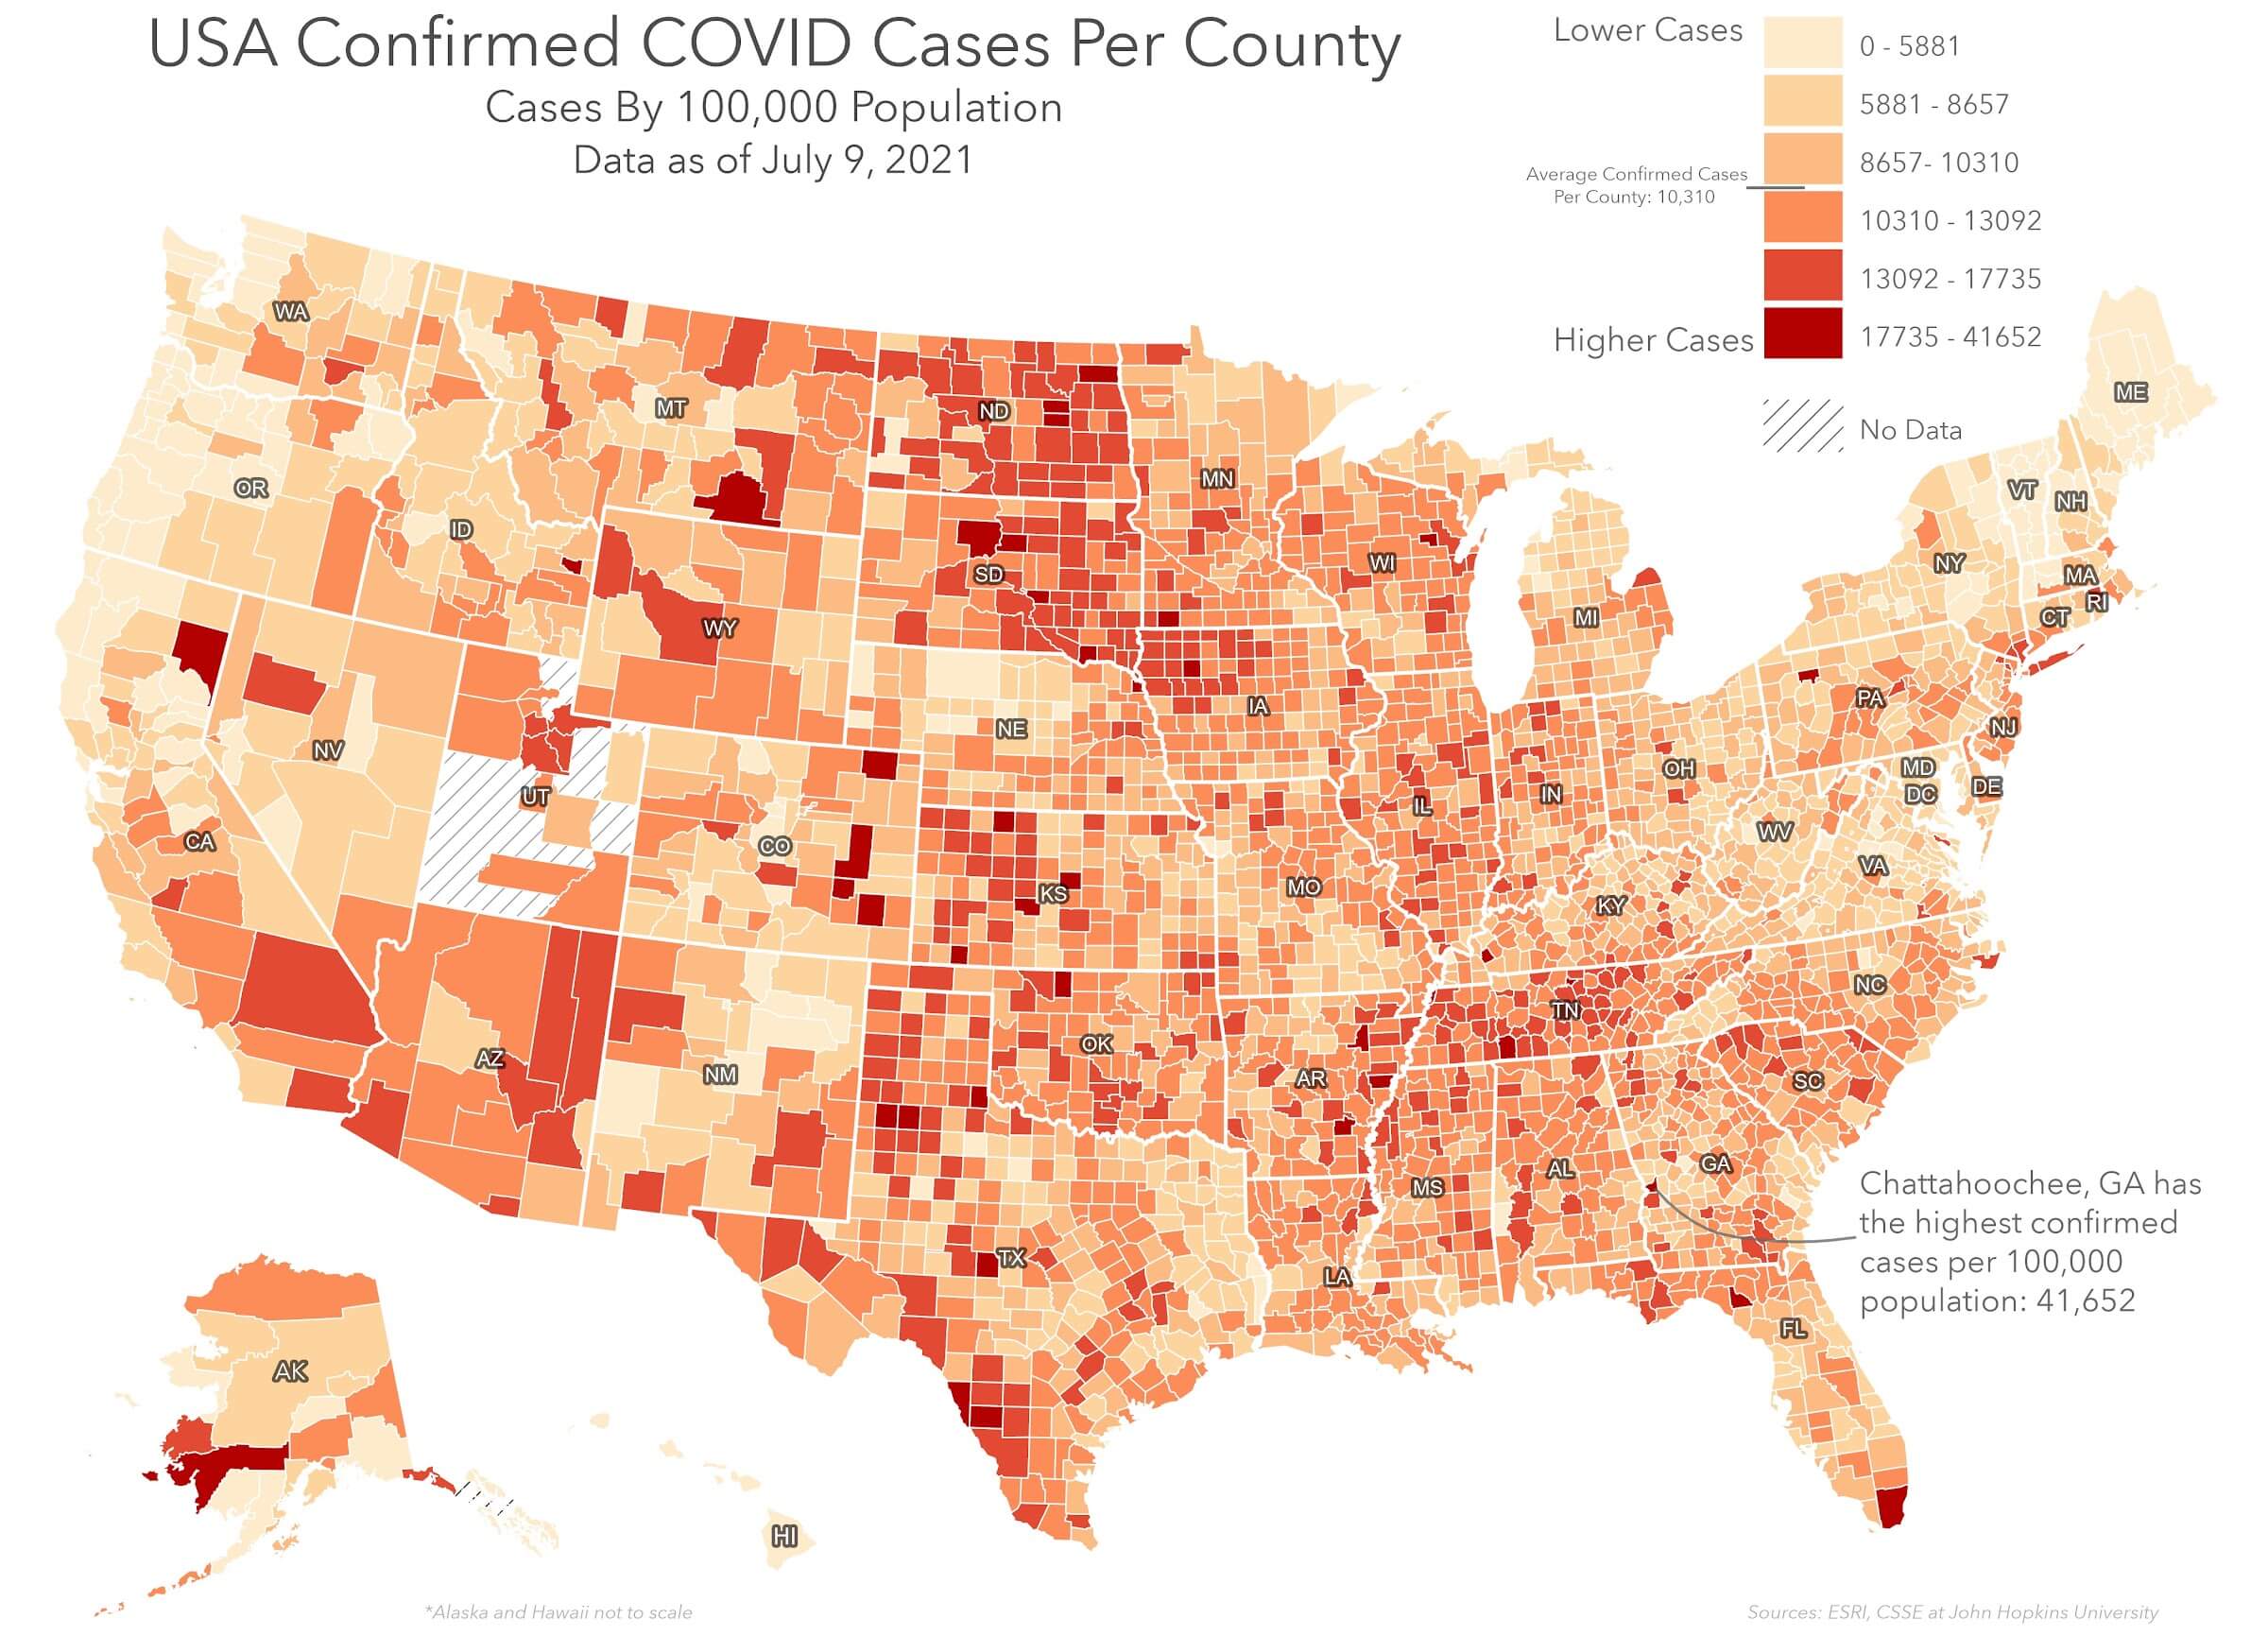
Choropleth maps: COVID data
Proportional Symbology