Calculate Land Surface Temperature
ArcGIS Pro Python script tool that will calculate LST from user's input Landsat 8 bands.
completed on: 2020-04-17
Update 11/15/2022: This tool will only work with Landsat Collection 2 Level-1 data for landsat 8. It is currently not compatible with Level-2 data.
I was working with some Landsat 8 data the other day and thought, “I wonder if I could calculate the land surface temperature using these bands?” I started up the google machine and found many resources offering instructions on how to estimate land surface temperature (LST) from landsat 8 bands. The steps seemed a little long and cumbersome, but I noticed that the entire process could be automated pretty easily, so I decided to create a tool for the process. I’ve outlined the three basic steps that the tool helps automate:
- Find and retrieve variables within a Landsat metadata file.
- Use bands 4 and 5 to create an NDVI layer.
- Make a series of raster calculations using the variables gathered from the metadata file, information from the NDVI layer, and bands 10 and 11.
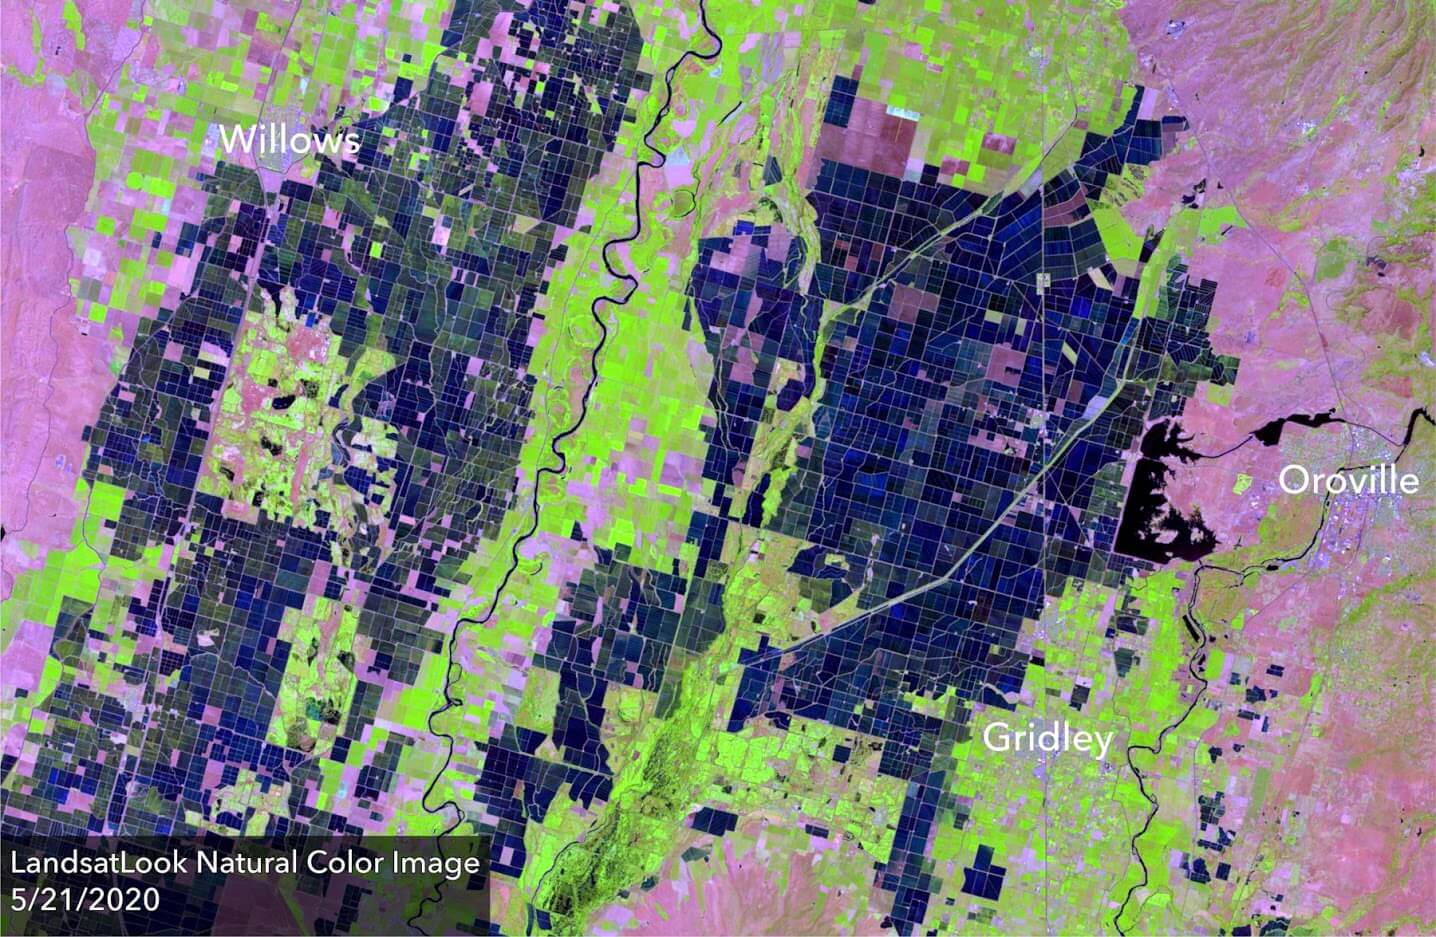
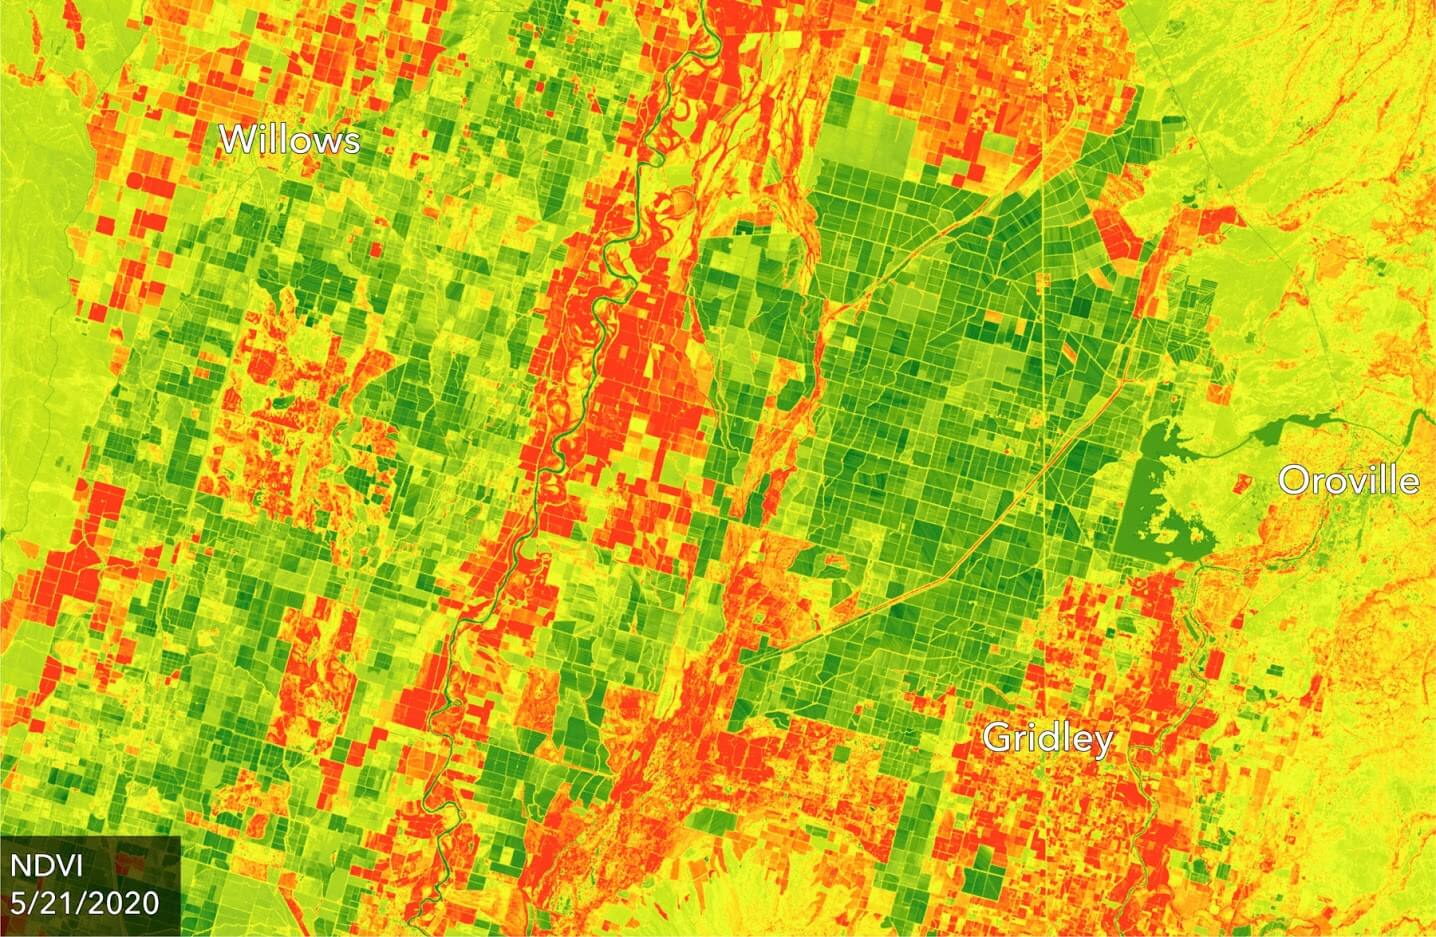
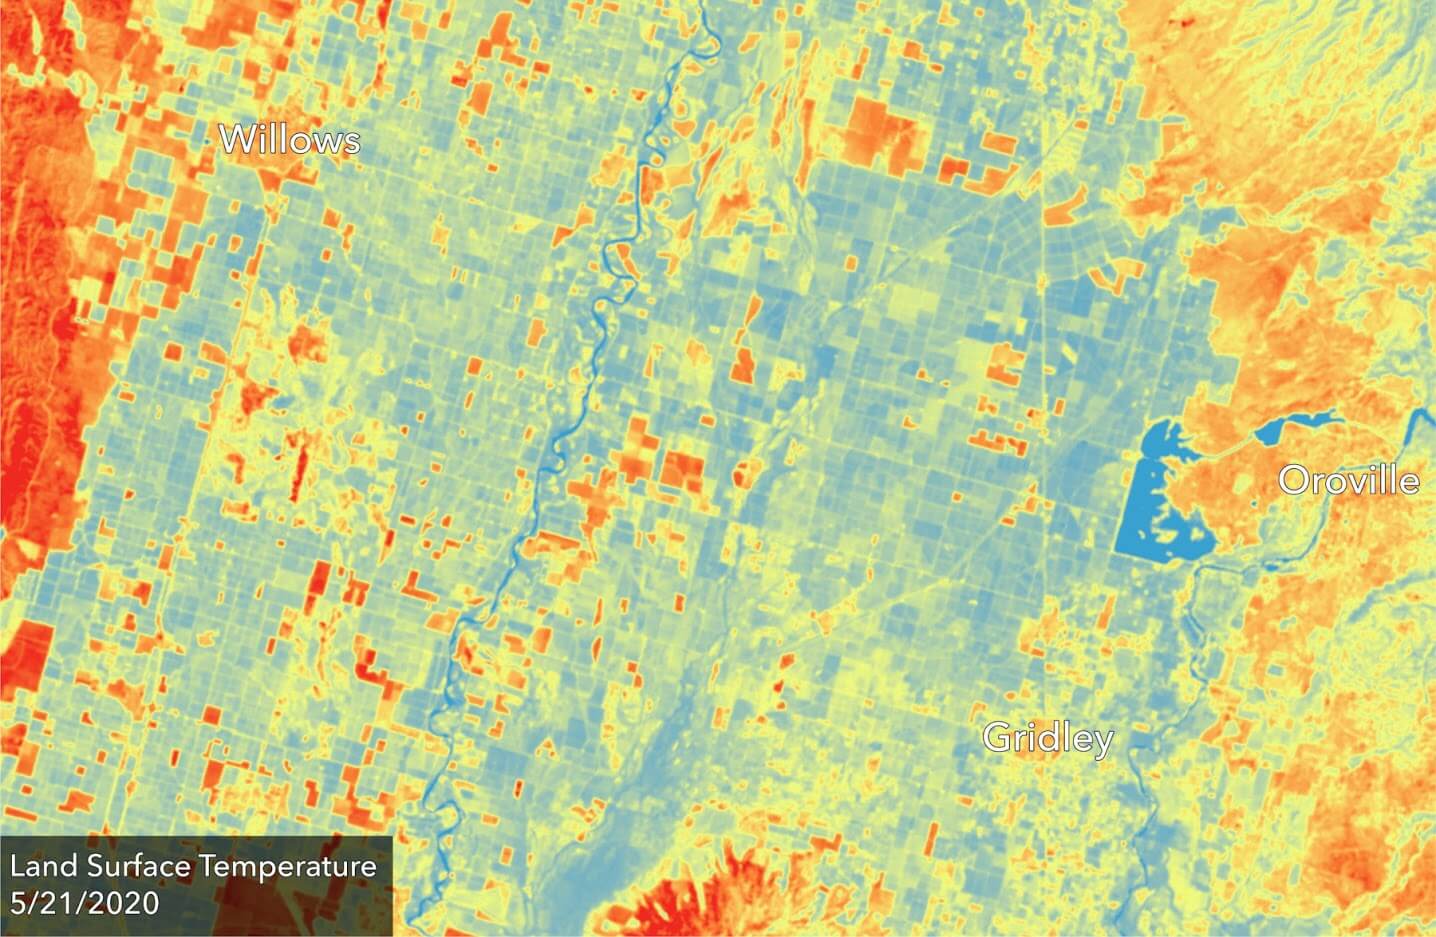
The top image is a Landsat 8 image of California’s central valley. The bottom image slider shows a couple output rasters from the LST tool. The tool outputs an NDISI raster and an LST raster, and optionally outputs an NDVI or MNDWI raster.
The images above serve as a good example of the value land surface temperature data can deliver to the agricultural industry. The top image shows a region of fields in the central valley of California. By using the tool I created, users can quickly create a land surface temperature raster visualizing fields that might be suffering drought stress or fields that are being over watered.
After doing the process manually a number of times, I started writing the python script as an ArcGIS pro tool.
The tool is capable of calculating the following products:
- LST (Land Surface Temperature)
- NDVI (Normalized Difference Vegetation Index)
- NDISI (Normalized Difference Impervious Surface Index)
- MNDWI (Modified Normalized Difference Water Index)
Use
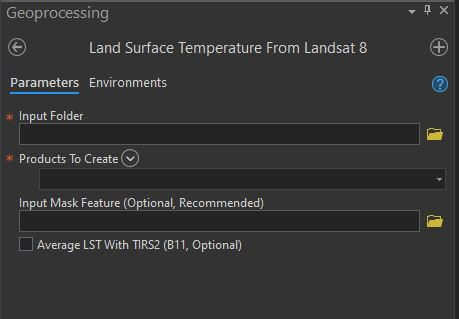
As shown in the screenshot above, the tool will need a path to the folder holding the Landsat 8 bands and metadata. To get this data, you may download a Level-1 landsat 8 bundle from the USGS’s EarthExplorer. Optionally, the tool can take a mask geometry. It is best to mask the rasters to the area of interest before the tool is run, or by using the mask option within the tool itself. I have included an empty polygon feature class for quick polygon creation within the folder (see zip of “MaskFeature_Sample.gdb”) on the github page.
The output LST raster will be in degrees Celsius. The output names will appear as: LST_184457GMT_20200403, which stands for Land Surface Temperature_Time Image Acquired in GMT_Date Acquired
Resources
- Analysis of Impervious Surface and its Impact on Urban Heat Environment using the Normalized Difference Impervious Surface Index (NDISI) - Hanqiu Xu
- Estimation of land surface temperature–vegetation abundance relationship for urban heat island studies - Weng Et Al.
- USGS’s Landsat Handbook
- USGS’s Level 1 Guide