Zillow ZHVI Dataset Dashboard
Creating a streamlit dashboard to filter the Zillow ZHVI public dataset
completed on: 2022-09-05
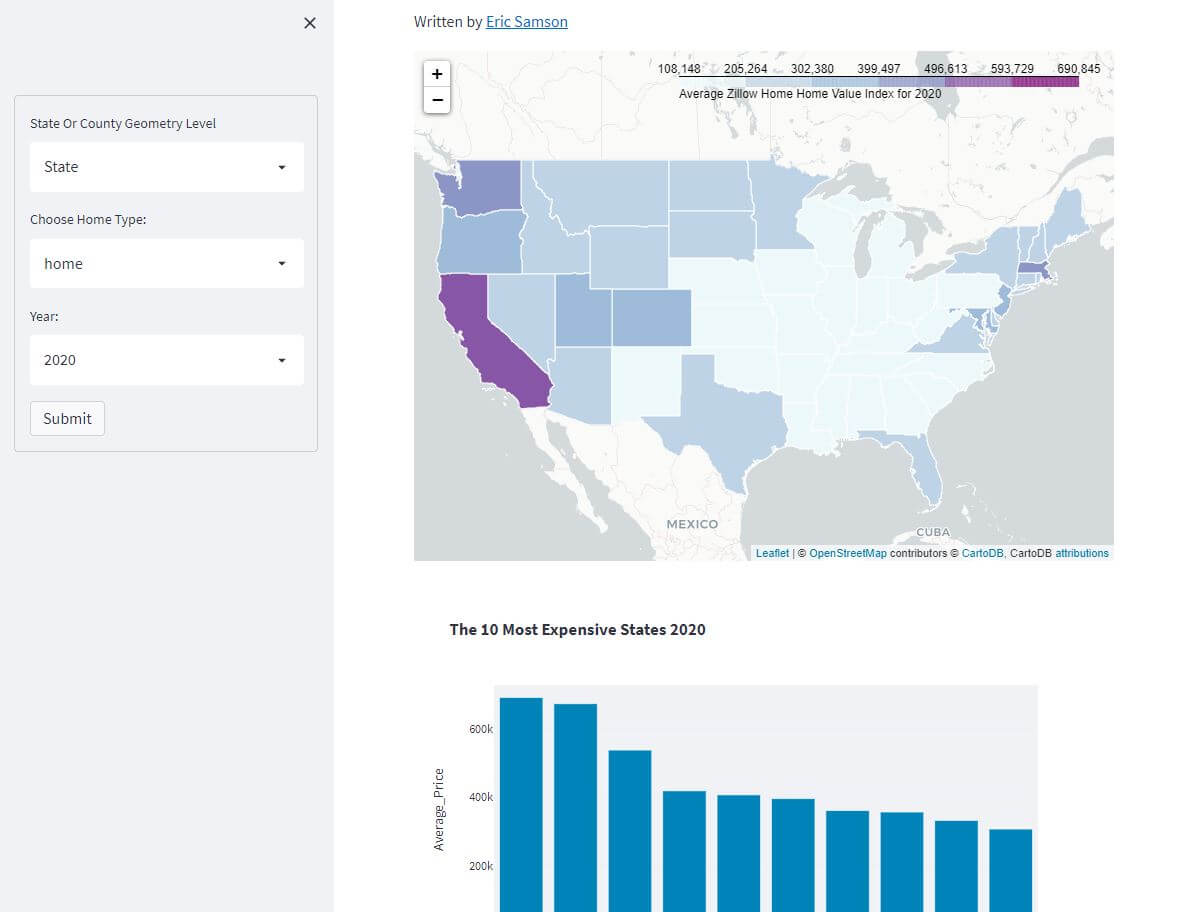
I continue to see more and people using streamlit to quickly build applications. I decided to give it a shot using a publicly availabe dataset. This dashboard shows Zillow’s Home Value Index (ZHVI) dataset, visualizing real estate trends across the United States. I wanted to make it map centric, so I used the folium package and some local geojsons to display the data as counties and states. The dashboard lets you filter by year and property type. I added a bar chart showing the most and least expensive regions, and a line chart showing trend analysis for monthly price changes.
Check out the live dashboard