PMTiles: No Server, No Problem
One file, no server, map tiles made easy.
written on: 2026-05-22
Protomaps Tiles aren’t new, so I’m late to the game. For most of my career I’ve worked in organizations that lean heavily on ESRI, and I never had a professional reason to dig into open-source vector tiles.
Then I had a free weekend to play with MapLibre on a side project, and I finally put PMTiles into practice. Using them is even better than all of the breathless LinkedIn posts made them seem.
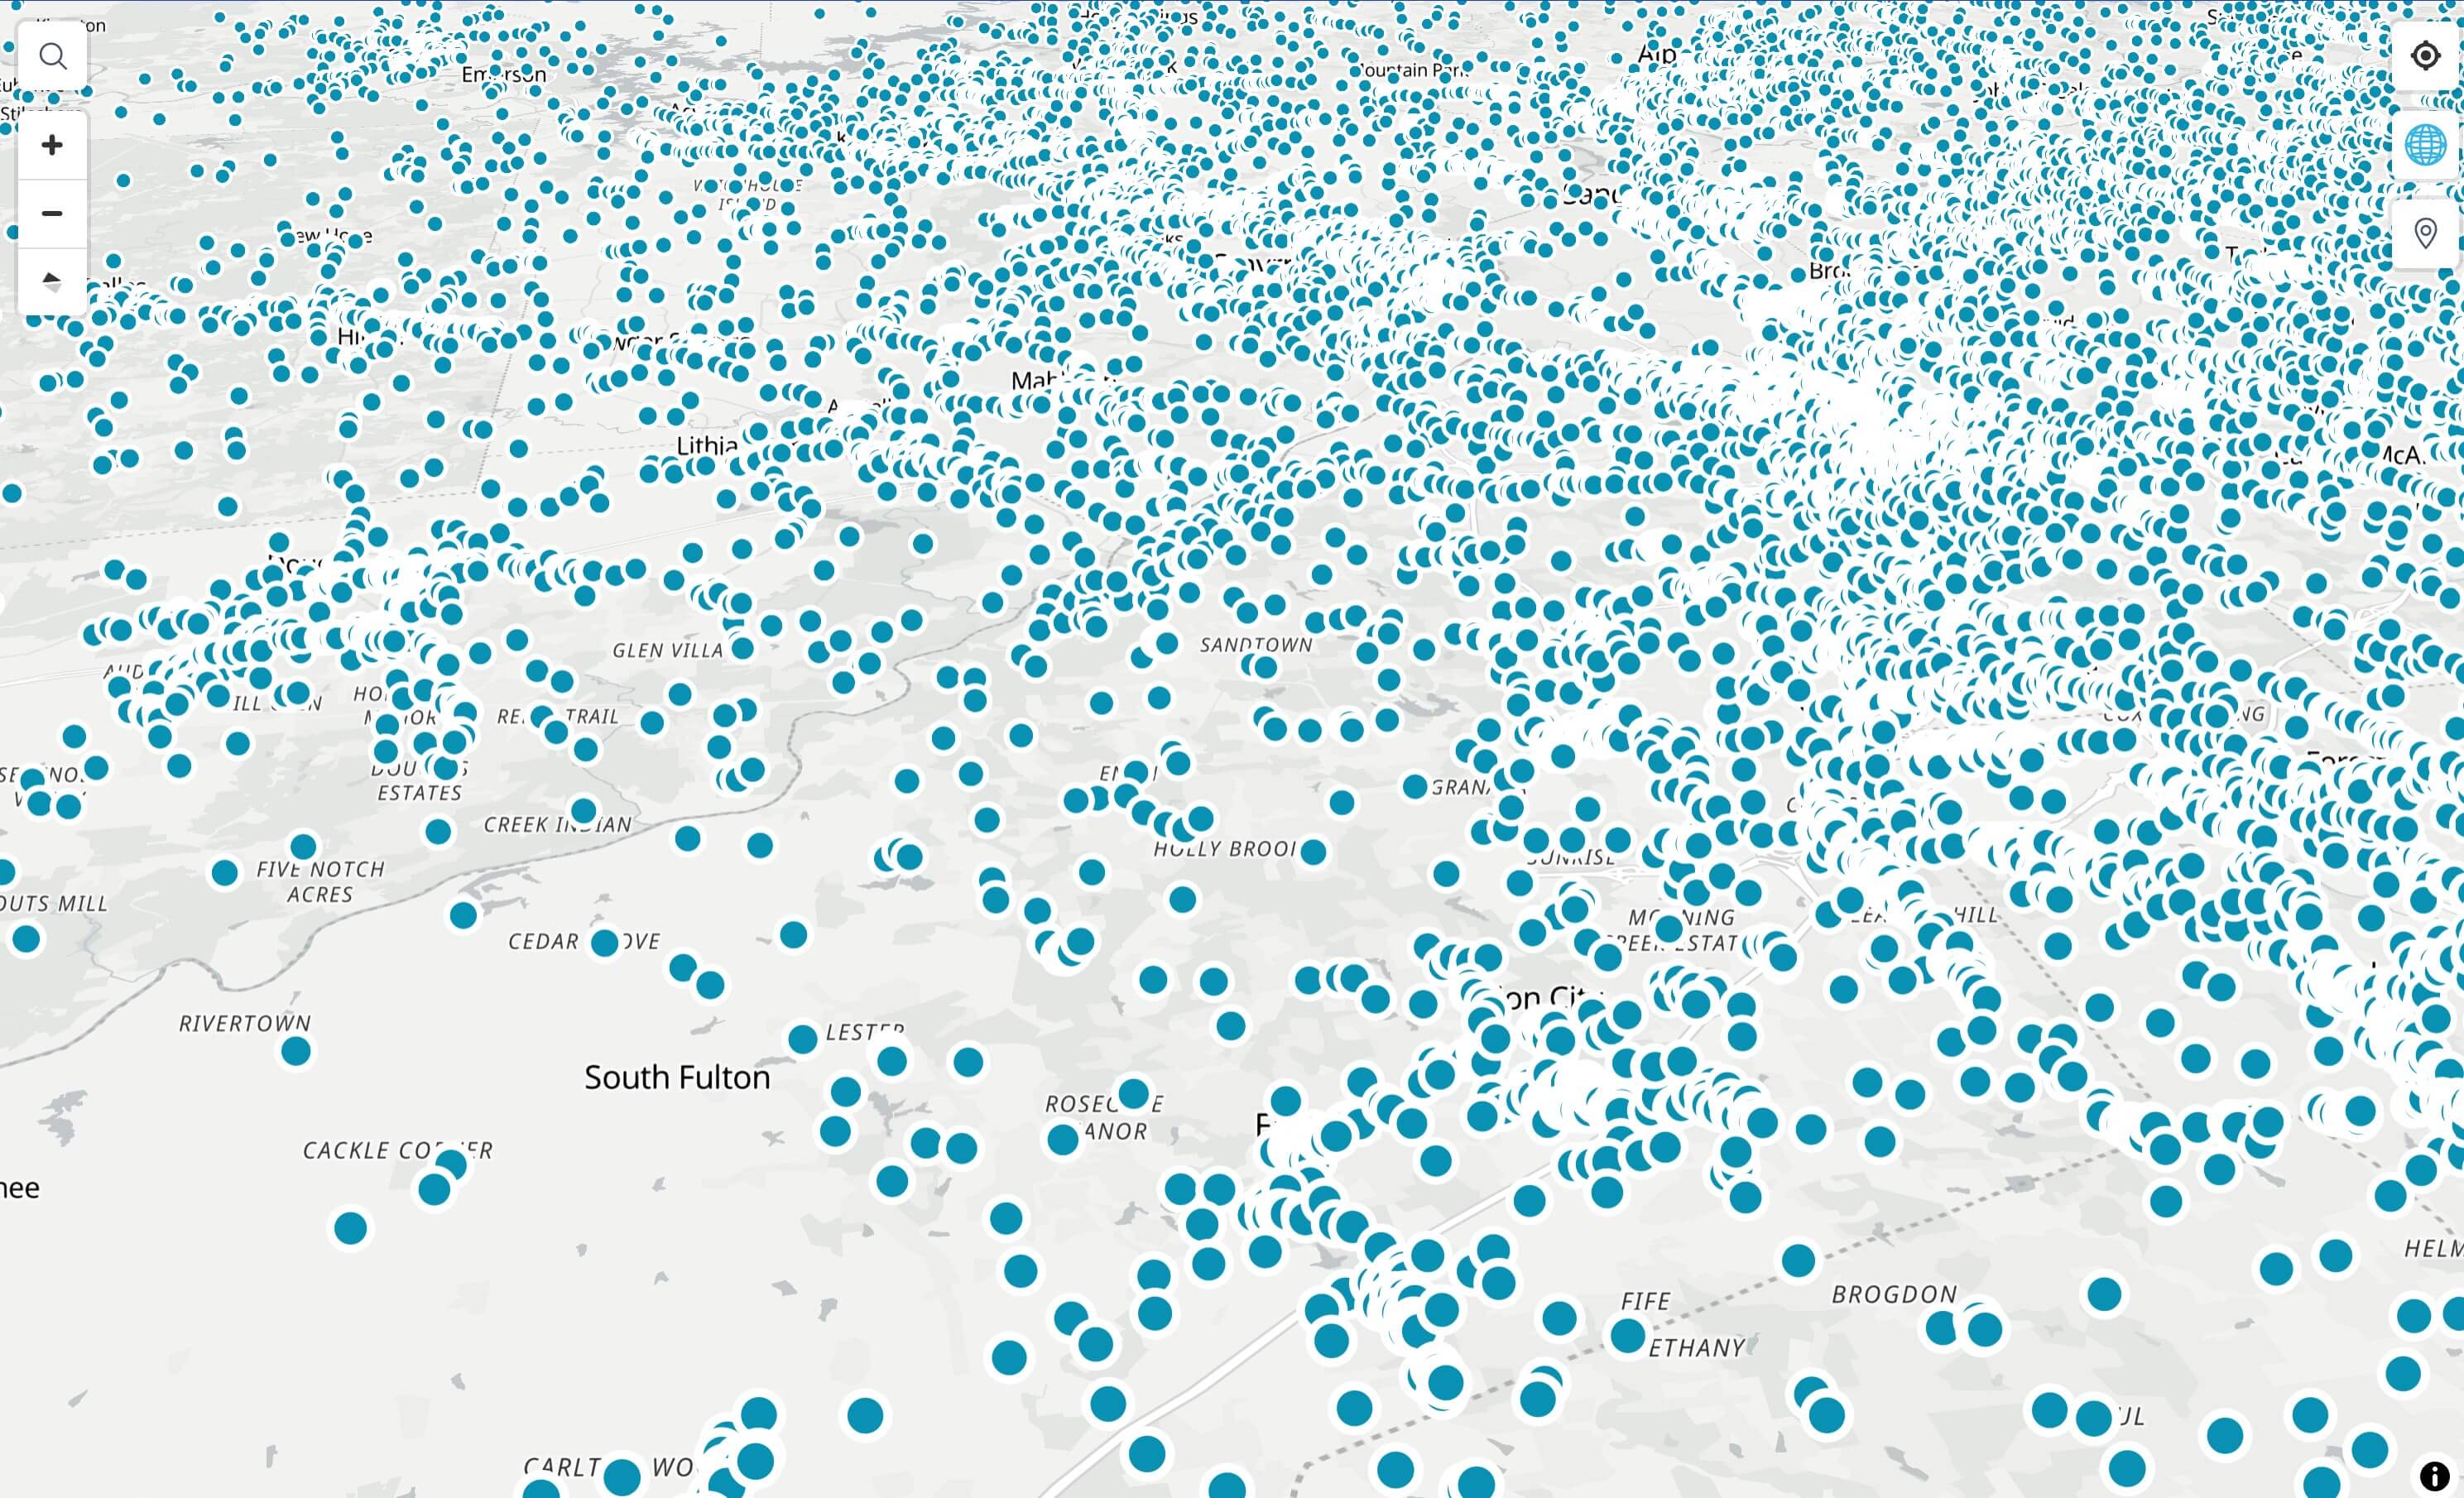
PMTiles is a single-file archive format for tiled data. You can host one on object storage like S3 or a GCP bucket and read it directly in the browser. Think of any tiled data you’ve worked with before, but far lighter. You can pack multiple layers into a single PMTiles file, though so far I’ve only tested one dataset at a time. Below is a map of every Microsoft building footprint for the state of Colorado, all 2.1 million of them:
As a GeoJSON, this file was 619 MB. The PMTiles version is 57 MB, but here’s the trick: you never download the whole thing. PMTiles is read with HTTP range requests, so the browser only fetches the handful of tiles in your current view, a few hundred KB at a time. The first time I packaged this dataset I capped it at a low zoom and the entire file came out to just 90 KB. That’s crazy. And you get excellent visualization performance to boot.
The drawback, of course, is that you don’t get clean access to the underlying geometries. If you need to do advanced geometry analysis in your front-end GIS, you’ll still want a backend database to query and retrieve those geometries (for example, when a user wants to grab a few parcels, copy the geometries, and save them into a different layer).
Filtering PMTiles also seems a bit confusing and clumsy, though that could be my own ignorance. So if you need filterable data, reach for a different file format. What PMTiles does give you is blazing-fast tiled visualization in a single file with no server. And you can include pop-ups! (Try clicking a building above.) After using vector tiles inside ESRI’s ecosystem for so long, this was a happy surprise. People have been requesting it for years, but I don’t think it’s something ESRI is interested in.
How to create a PMTiles file
I like to use GeoPandas for all of my GIS data conversion and analysis, so I set out to do the whole conversion in Python. Online, most people suggest Tippecanoe for the conversion, but I’m on a Windows machine, and getting Tippecanoe installed on anything that isn’t a Mac is a huge pain.
Luckily, I discovered that the newest version of GeoPandas can export a GeoDataFrame directly to a PMTiles file.
I used the notebook in one of my GitHub repositories. That repo also has a file called spatial_ops.py with a bunch of functions I use all the time to clean up data quickly.
We’ll use the Colorado Microsoft Buildings file from the map above for the example below.
1. Read the data
The first step is simply to read the GeoJSON file fully into GeoPandas. This takes a minute, since it’s a relatively large file:
import os
import pandas as pd
import geopandas as gpd

from spatial_ops import (make_gdf_valid, remove_small_holes,
                         simplify_geometries, drop_duplicate_geometries,
                         export_layer)

in_file_path = r'...\Desktop\Colorado.geojson'

gdf = gpd.read_file(in_file_path)
gdf.to_crs(epsg=4326, inplace=True)
gdf.columns = gdf.columns.str.lower()

# review data
pd.set_option('display.max_columns', None)
gdf.head(5)
I like working with lowercase column names, so I always include that line. I also convert to EPSG:4326 the moment I start working with a dataset, so I always know what projection it’s in and can change it later if needed; no guessing required. We want the final dataset in 4326 for MapLibre anyway, so that works out nicely. The last line gives me a quick look at the data and its columns.
2. Drop columns
In the next cell I keep only the columns I want, rename the geometry column to geom (a habit, it doesn’t matter), and set it as the active geometry column so GeoPandas knows what’s going on:
keep_cols = ['release', 'geometry']
gdf = gdf[keep_cols].copy()

cols_rename_dict = {'geometry': 'geom'}
gdf.rename(columns=cols_rename_dict, inplace=True)
gdf.set_geometry('geom', inplace=True)
3. Clean up the geometries
Here’s the fun part. I have four functions I reuse all the time: they drop duplicate geometries, simplify geometries, remove small holes within polygons, and fix (make valid) all geometries in a dataset. You can review them in spatial_ops.py, but they’re a huge help in shrinking larger polygon files.
For this dataset, I ran the following:
gdf = drop_duplicate_geometries(gdf)
gdf = simplify_geometries(gdf, tolerance_meters=5)
gdf = remove_small_holes(gdf, min_hole_area_sqm=20)
gdf = make_gdf_valid(gdf)
I used 5 meters for the simplification and removed any holes smaller than 20 square meters within a building. This clears out little slivers and other oddities in the geometries. There probably isn’t much of that in this dataset, but it only takes about three minutes to run.
4. Export to PMTiles
Run the following and let GeoPandas do its magic. Since we only need to see the buildings when we are close up to the map, I set the min zoom and max zoom values manually.
This takes a long time to run, so be patient; for me it took about 18 minutes. Under the hood, GeoPandas is secretly converting to MBTiles first, then converting that to PMTiles.
You should end up with a file around 57 MB. The max zoom is the biggest difference maker on the file size. Imagine every level you add storing all 2.1 million buildings at finer detail. Capping it at 12 keeps the file small while still looking decent.
output_layer_name = 'co_microsoft_buildings'
output_file_path = os.path.join(r'...\Desktop', f'{output_layer_name}.pmtiles')
gdf.to_file(
    output_file_path,
    driver='PMTiles',
    MINZOOM=8,
    MAXZOOM=12,
)